Pages

Monday, December 27, 2021

Selling Our Sol

Marika and I are up in Michigan right now for holiday visiting. Along the way we passed a large solar farm. On a previous trip, passing the same spot, Marika posed an interesting question: How much power could we possibly get from solar? Is it enough on its own?

There are a couple complications with this question: the broadest approximation would be to take all the power that hits the Earth from the Sun in 24 hours. That works out to about 6 million terrawatt-hours. The total daily use of the planet is around 459 TWh, well below the power that's hitting us from the sun! Of course, that assumes we have perfectly efficient panels, and cover the entire planet with them, so that's not exactly realistic.

Let's consider the sort of solar cells currently available. The conversion efficiency is a bit involved, but I decided to go with 15%, based on the silicon cells mentioned in that article. We also need to consider the angle that the light hits the cell. For that, we need the position of the Sun, and the tilt of the panel. You can get setups that track the Sun as it moves through the sky, but I went with a fixed panel. In that case, the optimal angle is tilted due South (North) in the Northern (Southern) hemisphere with an angle equal to the latitude, e.g. the panel would be standing up straight at the North Pole, and flat at the equator. I took the power generated by the panel to be proportional to the cosine of the angle between the Sun and the face of the panel.

As a first test, we can look at the power generated (in Watts/square meter) over the course of a day:


Notice that since we're looking at January 1st, the brightest spot moves over the Southern Hemisphere. We can also take a look at the maximum power generated each day over the map:

Notice how the maximum moves North and South with the seasons. Now for the key question: How does this compare with current energy usage?
As you can see, our energy needs (in red) are several orders of magnitude below solar generation, even with today's inefficient panels. However, it's a bit impractical to cover the entire landmass of the Earth with solar panels, so it might be best to include some wind, hydroelectric, and geothermal power sources as well. Another option would be putting the solar collectors in space, and beaming the power back down to Earth, as in a favorite game from my childhood, SimCity 2000. Of course, that would occasionally miss, and level a few buildings with the beam...

Thanks for a great question, Marika!

Sunday, October 24, 2021

Mind Your Pizz’s & Queues

Most Friday nights, Marika and I like ordering pizza for dinner from our favorite Gainesville spot, Satchel's Pizza. Being a Friday night though, many people have the same idea, and we can often get stuck with long wait times. This past Friday, we decided to get our order in earlier, ended up getting in before the rush, and our pizza was ready sooner than we would have liked. This situation, strategizing our moves relative to others trying to do the same thing, reminded me of a project I was part of when I first started at the University of Michigan. It was in a parallel/sub-field to Physics called Complex Systems, where we try to apply techniques from Physics to other systems. In this case, we were looking at co-adaptation and co-evolution. Our model involved simulating a group of agents that would act on an environment with different strategies. Based on the strategy, they would change the environment, and get some benefit or penalty, then try to change their strategy for more benefit.

How does this relate to pizza ordering? The other customers and I are the agents, acting on the pizza place. We choose when to place our orders, and based on how many orders are ahead of us, it takes the pizza place a certain amount of time to prepare the order. We then change our ordering time according to how close to dinnertime our pizza finished. The adjustment I settled on was

This says we adjust our ordering time by 10% of the time between when we want to have dinner, and when we actually got our pizza. I put the 10% in there to make the transitions a bit smoother.

The pizza place I modeled as a set of ovens and a queue. When a customer orders, they're added to the queue, and each empty oven will serve the first customer in the queue, and take 20 minutes to cook the pizza before becoming empty again. I was curious how the customers would change their order times, and what kind of wait times would be involved. I decided to run the simulation with a couple different numbers of ovens, and see how things changed. I decided all the customers would try to eat at time t=0, and use t=-20 minutes as their first order time. Here are the average order times used by the customers at each iteration:

After some initial transients, each of the oven cases settles into a sinusoidal pattern, but with different amplitude and frequency. We can also look at how far off the customer was from their dinnertime:
A couple weeks ago was Homecoming weekend, and the wait times did indeed get into the 2 hour range! Where these results get really interesting is if we combine the previous two plots into one showing the relationship between the order time and the wait time:

This has the appearance of an attractor, a common feature of complex systems, where the state will trend toward an equilibrium point, but not necessarily reach it. This is the average over all the customers though, so we can also look at the individuals over time:

It seems the other Satchel's customers and I are trapped forever in a cycle of never getting our pizza quite when we want it!

Sunday, October 10, 2021

Blade Sprinter

Shortly after last week's post, I got a followup from my brother Nate: I like your latest blog post about how you feel the need for speed-mowing. However, I think you did not follow your curve far enough. Can you make a follow-up post where you show when travel-speed becomes a problem because the blades don’t cut all the grass?

What Nate is suggesting is that as the speed of the mower across the grass increases, the speed of the blade relative to the grass during part of its rotation will slow down, since it's moving in the opposite direction:


We can write an expression for the ends of the blades using a parametric equation:


where v is the forward speed of the mower, and ω is the angular velocity of the blades. The manual for the mower gives the blade speed as 2800 RPM, so we can look at how the coverage changes as we approach the speed of the tips, which works out to about 200 MPH. I tried a couple different steps in the range, along with the mower's default maximum, 3 MPH:


Around 60 MPH, we can see some gaps appearing, and if we went for the full 200 MPH, we'd be missing about half the width of the mower. On the other hand, I could finish the lawn in 17.3 seconds, so maybe there's something to Nate's idea! In fact, he's far from the first person to consider supercharged lawnmowers, though that example only went up to ~27 MPH. Call a physicist when you really want to exceed the limits of reality!

Sunday, October 3, 2021

That's Mow Like It!

[Title shamelessly stolen from The Simpsons.]

Yesterday, I mowed the lawn with our fancy electric mower, which has a nice speed control for its self-propelling feature. It got me wondering though: What's the most efficient speed to mow the lawn? The blade is constantly running, so it seems like finishing the lawn as quickly as possible would be best, but then the drive is using more power. Is it better to use a lower drive speed to save energy?

I couldn't find many details on the battery/motor specifications, so we'll have to make some assumptions: I'm not sure how the variable drive speed/constant blade speed would work with a single motor, so I'm betting there's two. That means we can split up the power use like this:


The manual gives a couple different cases for battery life, but since it applies to both the self-propelled and meatbag-propelled models, I'm guessing it's assuming the drive is off, so that only tells us about the blade power. For the drive power, I decided the closest analogy would be an electric golf cart. We can look at its power use, then scale it by the ratio of weights and speeds. This model uses 2.6 kW to haul 270 kg at 15 mph. The mower weighs 28.4 kg with a top speed of 3.1 mph, so a rough approximation for power would be 57 Watts.

Now there's the question of efficiency: When we put power into an electric motor, how well does it put that power back out? Luckily, I found a great DoE paper on how the efficiency changes with percent of maximum power. I grabbed a couple points from Figure 1 and did a rough curve fit:

where e is the output efficiency and L is the fractional load.

For the "light load" case, the manual says the battery, which holds 7.5 Amp-hours of charge and runs at 56 Volts, will last for 60 minutes. After a bit of computation, that means the blade is using 420 Watts. Now we need to know how long it takes to mow the lawn, depending on the speed. Using a tool like this, we can find the total area of the property, 1065 m^2, and the total area of the house, 246 m^2, to find the approximate area of the lawn, 819 m^2. The mower is 0.53 m wide, so the minimum total distance it would have to travel is 1545 m.

We now have a long chain of relationships we can put together. The total energy used is

where P is the power, and t is the total time. The time it takes to mow is

where d is the distance, and v the velocity, which in turn is
The power, from earlier, is
The equation we get from putting all these together is a bit involved, so I just made a plot instead:

The battery's total capacity is about 1,500 kJ, so even at the slowest speed we're well within a single charge. I was hoping using the motor efficiency curve would give a more interesting result than "go as fast as you can," but since the maximum load is most efficient, that's the result. Maybe my next step will be figuring out how to balance the exertion of following the mower with the time out in the hot sun!

Sunday, September 26, 2021

Cyclopian Cyclones

For the past 2 weeks, I've been struggling with a question from Papou, as well as struggling with a stomach bug which probably didn't help, but I finally have an answer! Papou wondered, How does the Coriolis affect hurricanes in the northern hemisphere and what is the percentage centrifugal velocity increase/decrease at the eight points on the compass assuming the hurricane is moving directly East to West?

Coriolis force is one of the fictitious forces that appear in a rotating reference frame, along with the centrifugal and Euler forces. If you look at articles on why hurricanes spin the way they do, they'll give explanations about how the speed of the Earth's rotation varies depending on how close to the pole you are, which causes the Northern edge of the hurricane to be pushed one direction, and the Southern edge pushed the other way. This explanation makes sense, but it didn't fit with my algebraic understanding of the Coriolis force.

If you look up the equation for the Coriolis force, you'll see it stated as

where Ω is the angular velocity of the rotating frame (for Earth, 2π/day), and v is the velocity of an object in the rotating frame. You may notice, there's no mention of radius here, which is why I was confused by the articles I was reading.

I decided to follow the default route for Physics: Simplify until things make sense! Let's imagine a hurricane directly over the North Pole. A key feature of hurricanes is the eye, which is a region of low pressure at the center. Low pressure in the middle means air will tend to flow from the outside in. As that air accelerates though, it will have a velocity perpendicular to the angular velocity, which is pointing straight up in this case. That will cause the Coriolis force above to push the air in a counter-clockwise direction, exactly what we're expecting.

I tried to put together a full simulation of the pressure difference driving the air inward, but then being balanced by the Coriolis force spinning it in a circle. Unfortunately, I couldn't come up with a model of the pressure that didn't vastly overpower the Coriolis force, so I ended up simplifying things a bit more: We assume the pressure difference causes a constant force inward, and then see how that changes under the effect of the Earth's rotation vector, projected into the local plane of Florida (27.7° N latitude):

For this simulation, I used a diameter of 300 miles and a Category 3 windspeed of 120 mph, but again, I had to fudge a bit to get things to work.

As for the second part of the question, centrifugal force doesn't really come into things here. For most places on the Earth, centrifugal force points upward, so its only effect on the hurricane would be a vertical circulation of the air. That may have an effect in reality, but I'm only considering a 2D model here, so it doesn't really apply.

I always have a hard time picturing these 3D systems, with interacting vectors and different reference frames, but I hope I've given a reasonable explanation for how these types of weather events form. I'm betting there's a way to connect my understanding of Coriolis forces to the one commonly given, but I can't puzzle it out. Thanks for another great question, Papou!

Sunday, September 5, 2021

On the rEvolution of Doorways

Dipping once again this week into my list of topics, I chose a particularly old one: revolving doors. Ever since my stay at Mass. General Hospital, I've been curious how efficient revolving doors are at keeping heat in or out, compared with sliding doors. Last time, aside from the disadvantage of chemo effects, I attempted to do a detailed simulation of the motion of particles through the doorway, which never panned out. This time, I took a much simpler approach using an approximation for the rate of heat flow between two reservoirs:

where Q is the heat energy transferred in a time Δt through a surface of area A. The temperature difference ΔT between the two reservoirs is spread over a distance Δx, and the thermal conductivity k is a property of the air, which we can look up. The idea with a revolving door is that the inside and outside are never in direct contact: The air moves from outside, to a segment of the door, then to the inside. I wasn't sure how to get the distance, since it will change with time as the air moves, but I went with a guess of 20 cm. For the dimensions of the door, I found an architecture page that gave some example measurements. I went for a 3-segment door. For each person who enters, the door will turn 120°, so we can try a few different rates.

Along with the heat transferred, we need to know the current temperature in each section of the door. That will be a simple scale factor, the heat capacity. Since the change in energy/temperature is proportional to the current energy/temperature, we'll get an exponential relationship in time, where the door section will approach the in/outdoor temperature, but never quite make it.

I put together a simulation with some values more suited to my current Florida environment: 20°C (68°F) inside and 35°C (95°F) outside. First, we can look at the temperature in each section of the door as it rotates with 1 person every 30 seconds:
I was surprised how consistent the temperature stayed – In total it's only about half a degree C in variation. To get a visualization of what was going on, I made an animation from the same run:

I find it really interesting that the oscillations are consistent enough that the door segments return to their original uniform temperature about every 1.5 minutes. I did not expect such a clean result.

Turning to the comparison with the sliding door, we can consider having direct contact between the inside and outside temperatures for the same time it takes for a person to go through the revolving door. We can add up the energy transfer over time for different rates of entry for both the sliding and revolving door. Below I've plotted the results on a log-log scale:
According to this model, the revolving door is only more efficient if more than 120 people per hour are going in/out. However, I suspect this could change drastically with the choice of the temperature spreading distance I mentioned earlier. A more reliable result may be that all the revolving door cases lose nearly the same amount of energy. I've often scoffed at airports that have motorized continuously rotating doors, on the belief that they were wasting power pumping air between the inside and outside, but perhaps I owe those architects an apology!

Sunday, August 22, 2021

Moonshotgun

I got another lunar question from Papou this week: If the same gun was fired on the Earth and Moon, proportionally, how much further would the bullet travel and would it have a greater velocity?

As I thought about this, there were a couple different effects that could make the bullet go further, so let's see how much each one contributes:

Drag

The most obvious difference between the Moon and Earth is the lack of atmosphere. That will come into a couple of these points, but this is the one most people might think of. When a bullet travels through the air, it needs to push the molecules out of the way. According to Newton, the air will push back on the bullet, creating a drag force:


where ρ is the air density, u is the speed of the bullet, A is the cross-sectional area of the bullet, and cd is the drag coefficient. The drag coefficient depends on the shape of the object, since some shapes are more aerodynamic than others. However, for bullets and other projectiles, people instead use the ballistic coefficient, defined as

where m is the mass of the bullet. We can combine these to write

where ad is the drag acceleration. The bullet is slowed down by this drag, meaning it won't get as far before hitting the ground. We can find the ballistic coefficient with tools like this one.

Gravity

Another difference that immediately comes to mind is the difference in gravity: The Moon has about 1/6 the gravity of Earth, which will make the bullet fall more slowly. The bullet's range is limited by how long it takes to hit the ground, so the Moon will allow the bullet to travel further.

Expansion of Gas

Bullets are propelled down the barrel by expanding gas from the gunpowder. Similar to the drag force above, on Earth air will get in the way. In this case though, rather than drag I think a better model is an opposing pressure on the other side of the bullet. If we assume the bullet has constant acceleration down the length of the barrel L, then the muzzle velocity is 
On Earth, the acceleration will be given by
where P is the pressure from the gunpowder, and P0 is the ambient pressure. Putting everything together, we can get an equation for the muzzle velocity in vacuum based on the one from air:

Plugging in some typical values shows that the speed increase is pretty negligible.

Curvature of Body

Since the Earth and Moon are both (approximately) spherical, as the bullet travels, the ground will begin to slope away, increasing the time it takes for the bullet to hit the ground. When I first started thinking about this question, one thing that came to mind was Newton's Cannonball:
Wikipedia

As the muzzle velocity increases, the projectile has further to fall, until it reaches orbital velocity and continues falling without hitting the body. For short distances, we can approximate this as 

Putting It All Together


I put together some code to run a simulation of the bullet's flight on Earth and on the Moon, but I ran into some problems with the drag calculation using the ballistic coefficient. I ended up approximating the drag using the drag coefficient for a hemisphere. For the bullet/rifle parameters, I used the numbers from Wikipedia's .22 rifle page, although I also tried cranking up the speed to see the differences. By far, the greatest effect on the range is the decrease in gravity, but drag has some influence, particularly for the higher speed. The curvature has no discernible impact.


In case you're wondering whether a gun would even work on the Moon, Mythbusters tested a pistol in a vacuum chamber, and found that the gunpowder does contain all the necessary chemicals to ignite. In fact, during the Space Race, Russian cosmonauts carried the TP-82 Survival Pistol, reportedly to fend off wildlife in case of crashes in the Siberian wilderness, but you can imagine it was advertised in case American astronauts got any ideas. Thanks for a great question, Papou!

Sunday, August 15, 2021

The Terror of Knowing What's Inside This Pot


Marika and I recently got an Instant Pot pressure cooker, which we've been enjoying making meals with. Naturally, I was curious about the inner workings of the pot, specifically how the temperature and pressure inside vary with time.

The concept behind a pressure cooker is that when cooking food in water, you typically can't heat it beyond the boiling point: Once the water reaches boiling, any energy you add just goes into making steam. Sometimes you want to cook things at higher temperatures, which is why frying uses oil. That's not very healthy, though, so it would be great to raise the boiling of water. You can do that a little bit by adding salt, which is often suggested for pasta, but that doesn't go quite far enough. Instead, you can put the water under pressure, which raises the boiling point.

A pressure cooker is a sealed container that you add water to, and then heat. As the water evaporates, the pressure builds inside the cooker, raising the boiling point. The pressure depends both on the temperature of the steam, and the number of water molecules that have evaporated:
This is the ideal gas law, with T the temperature in Kelvin, V the volume, R a constant, and n the number of moles of gas molecules. A mole is a way to count very large numbers of things, equal to Avogadro's number, 6.022 * 10^23. My grandfather, a chemist, used to say that he and my grandmother had "Avogadro's Anniversary", because they were married on 10/23.

In order to add molecules to the steam though, we need to boil the water. The temperature that water boils at will change as the pressure increases. Even after we get to boiling, we need to overcome the latent heat to get the water out of the liquid phase and into steam. To accomplish either of these goals, we need to add energy to the system, which translates into temperature through the heat capacity.

Putting all this together with the specs of our model, we can look at the temperature and pressure for two cases: The minimum amount of liquid in the pot, 2 cups, and about half-full, 12 cups.


I was surprised by how quickly the pressure rises once we hit boiling – I kept a constant amount of power throughout the calculation, which causes the pressure to quickly exceed the working range of the pot. You can see the extra energy being used to push more molecules into steam in the sudden change in slope of the temperature plots.

I was hoping that by studying pressure cookers a bit more closely, I'd find them less terrifying to use, but I'm not sure these results are very soothing! I'll just have to keep singing to myself, "Mm ba ba de, Um bum ba de, Um bu bu bum da de..."

Sunday, August 8, 2021

Vault of Secrets

I'm still here! I've missed posting the last few weeks thanks to a couple trips to visit family, and some home improvement projects, but things have settled down, and I finally have a weekend where I'm not too exhausted to come back here. This weekend, Marika and I have been watching some Olympics results, and seeing Katie Nageotte's gold medal-winning vault reminded me of something I've wanted to look into: the Fosbury Flop.

Popularized in the 1986 Olympic high jump by Dick Fosbury, the Flop is a clever bit of physics that lets an athlete jump over a bar, despite their center of mass going under it. That means that they can clear a greater height than their speed would normally allow. By bending their body over the bar, the jumper can keep most of their weight below it. This diagram from Wikipedia is helpful:

Wikipedia

I wondered whether I could see if Nageotte was able to benefit from the same sort of trick. I took a few frames from the video linked above, and picked some key points on her body: head (blue), arms (red), torso (green), legs (yellow), and a point on the bar (black).


Once again using that creepy Air Force document listing body part masses that I used for the chicken-slapping post, we can find Nageotte's center of mass:


This says that the position of the center of mass is the weighted average of the positions of all the bits of mass we're adding up. We still need to relate the height of this center of mass to the height of the bar, but that's made difficult by the camera angle: The height in the frame changes as we move horizontally. We know the bar is level at 4.9 m though, so we can use its endpoints to draw a line relating the horizontal and vertical positions. Putting everything together, we can find Nageotte's center of mass relative to the bar:

Based on my estimates, her center of mass did clear the bar, but by less than a foot! I'm not much of a sports fan, but I still am impressed by the feats performed by these athletes. Congratulations to all the Olympic contenders!

Saturday, April 24, 2021

Birthday Bifurcation

Today is my 32nd birthday, and since 32 is 2^5, or 0b100000 in binary, I've got binary trees on my mind! A binary tree is a way to order data, and assign labels to groups. The typical structure is that you have a collection of connected nodes. Each node branches to two nodes below it, usually representing things less than, and greater than the head node. In the case of my life, we can consider things before and after I was 16, then things before and after I was 8, and so on, splitting in half each time. For example, here are all the places I've lived:


Because there's a green dot at the 1/2 level, we can tell I lived at least half my life in Ashfield, and the red dot at 1/8 means it took more than 12% of my life to get my PhD!

I'm now 10 years out from my cancer treatment, and so life sans brain tumor is growing in size:

On a lighter note, I'm now 4 years into marriage with a wonderful woman, without whom I could not have made it this far:


Marika and I have only been together for 1/8 of my life so far, but she is a bigger part of my life than I can ever express. I look forward to many more birthdays together to come!

Sunday, April 18, 2021

Stochastic & Fantastic

As I've mentioned before, I keep a list of potential topics that I choose from now and then, and this week I thought I'd look back at an article that caught my interest 2 years ago. Scientific American had a story about a beetle that looked for recently-burned forests using a process called stochastic resonance. The beetles use this process to sense heat from great distances, when normally those heat signals would fall below the background levels. Paradoxically, they do this by adding more noise to the signal. I was curious if I could model this type of effect, to get a better feel for how it works.

In its simplest form, we have 3 parameters for this system: The signal strength, the amount of noise added to that, and the threshold for detection. The principle is that even if the signal is smaller than the noise, we still have signal + noise > noise. That means if we can pick our threshold so that noise < threshold < noise + signal, we'll be able to pick up the signal.

Following an example used in the Wikipedia article above, I decided to use a black & white image as the target signal. I settled on one of the more iconic photos of a certain physicist. Below, you'll find the 3 controls I described. Try turning down the overall signal, then adjust the noise and threshold to pick out different features.

Sunday, April 11, 2021

Deluxe Model

This past week, my friend Kevin Labe let me know his group was going to be making an announcement of some exciting results from their experiment, called "Muon g-2". The experiment relates to the predictions made by the Standard Model about how charged particles behave in a magnetic field. Before we get to the results of the experiment, let's talk a bit about what is expected.

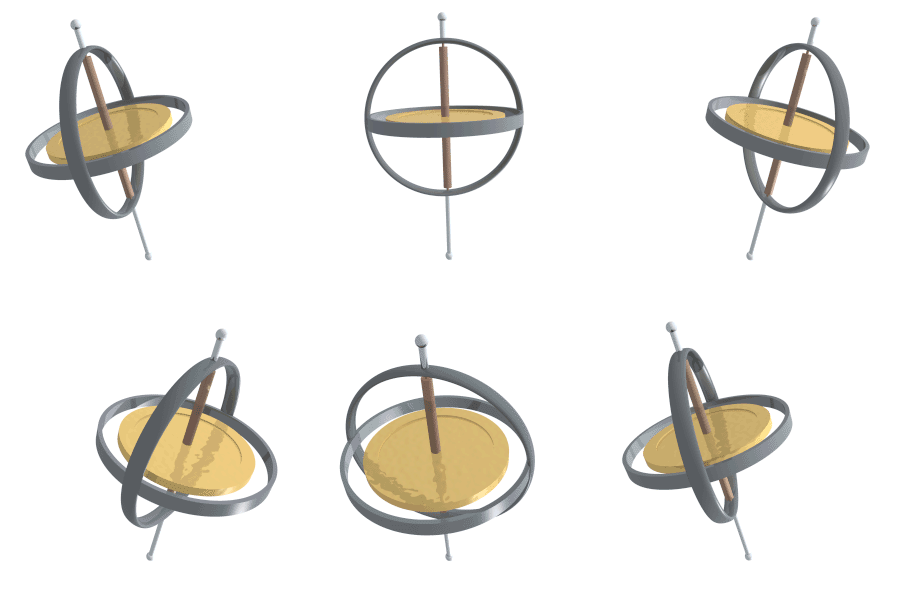
Subatomic particles have a property called spin, which is related to their angular momentum. Since we're talking about a scale where quantum mechanics applies, it's not completely analogous, but you can imagine a gyroscope:

Wikipedia

If the particle also has an electric charge, that spinning results in magnetism – Charge moving in a circle generates a magnetic field, like the coils in an electromagnet. If we put that particle in a magnetic field, it will precess (wobble), just like the gyroscope above precesses in the gravitational field. The strength of the particle's magnetism is called its magnetic moment, and it determines how quickly the particle precesses.

Measuring a particle's magnetic moment is exactly how an MRI scanner works, though in that case we measure the moment to identify the particle, while here we are specifically measuring muons. The magnetic moment is theoretically given by

where e is the charge of the particle, m its mass, and S its spin. The bit in question is the factor g. At first, theoretical physicists thought g was exactly 2, but after further calculations found that it was slightly more than 2, leading to discussions of the anomalous magnetic moment and experiments measuring g minus 2.

The reason that g is not exactly 2 is because on a quantum scale, when particles interact they can exchange "virtual particles" which appear and disappear in the process of the interaction. These are usually represented with Feynman diagrams:
Wikipedia

You read these diagrams from left to right; in this example an electron and a positron (which travels opposite the arrow's direction, since it's an anti-particle) combine to make a virtual photon (blue). This photon then turns into a quark and anti-quark, which releases a gluon (green). Often the same initial and final particles will have many different paths they can follow – different types of virtual particles forming in the middle. Each of these paths will change the properties of the interaction.

Now back to the case at hand: Theorists have tried to account for all the possible virtual particles, and come up with a value for g that falls just above 2 (I won't try to express the exact value). Prior to the experiment at Fermilab, the only group that had tried to measure g experimentally was at Brookhaven National Lab. However, the result they found was outside the range predicted by theory. Their error though was not quite at the 5σ, or 5 standard deviations, level required to claim a discovery.

Fermilab's big announcement was that not only had they improved on the BNL error with a significance of 4.2σ, but their result was consistent with the previous measurement. If correct, this implies there are virtual particle interactions not accounted for by the Standard Model, i.e. new particles. Congratulations, Kevin, on being a part of this exciting work! Perhaps the explanation will be the formation of a virtual Labeton...