Pages

Showing posts with label Food. Show all posts

Monday, May 5, 2025

Oh, what a world, what a world!

A while ago, Marika started making homemade vegetable broth from scraps. The recipe makes a large batch at a time, so we freeze it in cubes to use as needed. Last week, I was defrosting some in the microwave, and I started wondering about the ideal power settings to use. Microwaves are designed to heat the water molecules in food – The molecules are electrically polarized, and the oscillating electric field from the microwave makes them rotate back and forth, which translates into heat. In ice, though, the molecules are locked in a crystal formation, and unable to absorb energy as efficiently. If we run the microwave at full power, a lot of that energy will be wasted until the ice begins to melt. That's why the defrost settings opt for lower power and longer time. Once we get some liquid water though, we could increase the power and let the water conduct heat into the ice it surrounds.

I was able to find a paper on simulations of water and ice in a microwave, which included some nice plots of the energy absorbed over time. I used an online tool to extract the data, then did some linear fits to estimate a power level for each:

You may notice I've left out units on this plot – Usually a major faux pas in physics, but (possibly due to suffering from a cold) I found I had to fudge things a bit to get my simulation to work, so bear with me.

With this information in hand, we can imagine starting with a block of ice at a given temperature, and applying a given amount of power, which is scaled according to the factor found above. Once the ice begins to melt, the water can absorb energy more efficiently, and then transfer that energy to the ice through conduction. Recall that to change phases, materials need to absorb some extra energy, called the latent heat. Therefore, the key points of the simulation are

  • The ice must be heated up to melting point
  • Once at the melting point, additional energy transforms ice to water
  • Water heats up as it absorbs energy
  • Ice can absorb energy from the water according to the volume of water and difference in temperature

We stop the simulation once all the ice has melted. I tried out a series of different power/time settings for melting the ice most efficiently. They're plotted below, with the y-axis showing the fractional power delivered at each time. The length of the line shows how long it took all the ice to melt, and the color shows the total energy used (the area under the curve).

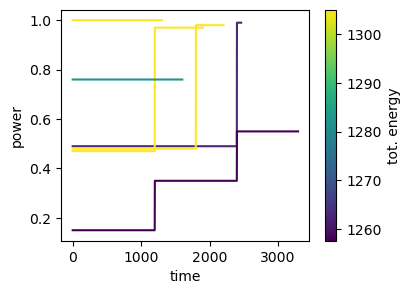
To defrost as quickly as possible, it's best to just blast full power, but this wastes a bunch of energy. To see why, we can look in detail at the max and min total energy cases:

These show that the vast majority of the time is spent just getting the ice up to 0°C. Once that happens, the water begins absorbing energy and speeds up the melting considerably. One caveat with this though is that the energy differences in the above are not huge – This makes sense, since the fraction of power absorbed by the ice and the energy needed to heat it to melting are constant. In my sickened state I didn't have the energy to test out heating routines as much as I'd like. I encourage you to try your own optimization of broth heating.

Saturday, September 21, 2024

Looking Radiant

In France we had the fancy induction cooktop, and the camper had gas burners, but now we're back in Michigan with the good old resistive coils I've used most of my life. One thing that's always struck me about these stoves is that then when turned on high, the coils glow red. This is due to black-body radiation, which is the spectrum of light emitted by objects depending on their temperature. For an ideal black-body, the color and brightness will be entirely dependent on the temperature. I wondered whether I could use this to find the temperature the stove heats to:

The Wikipedia page for black-body radiation has a nice chart of the overall color for different temperatures:

Wikipedia

We can get the RGB values of those colors and compare to those from the stove picture:

The solid lines represent the values from the chart, while the dotted lines are samples I took from the image. The red and green aren't bad, but you can see my samples have way too much blue for a true black-body. Ideally, a black-body shouldn't reflect any light, absorbing it all instead. This brought to mind Vantablack, but I'm not sure how that would stand up to high temperatures, and it seems like a dangerous world to get into.

To resolve the discrepancy in color distribution, let's try looking at the overall brightness by taking the root sum squared for the above:

For 3 out of the 5 samples, we get a crossing at around 1600°F. I couldn't find a definitive source for maximum stovetop temperatures, but I found a Reddit post that suggests the range 1470°F to 1652°F, agreeing nicely with my measurements!

The neat thing about black-body radiation is how universal it is: When a welder heats metal to the same brightness as the Sun, it's because they're the same temperature, and the whole universe is still glowing from the heat of the Big Bang!

Sunday, November 19, 2023

Dribble Cup

Earlier this week, I took my water bottle out of the fridge and, without thinking, put it near the small heater we had running. In seconds it was spewing water all over the table!

I figured the heat made the air at the top expand, pushing the water out through the straw, but what I was really curious about was: Does the amount of air the bottle starts with change how much water is forced out?

Air follows the Ideal Gas Law, which is given by

where P is pressure, V volume, N number of molecules, k Boltzmann's constant, and T temperature in Kelvin. That last bit is important: We usually measure temperature in degrees Fahrenheit or Celsius, which can be negative. Kelvin on the other hand is only ever positive: 0 K corresponds to absolute zero. We can convert from Fahrenheit with

In our situation, the temperature rises, which increases the pressure the air applies to the surface of the water. This pushes water out, increasing the air's volume, and bringing the pressure down. At equilibrium then, we can set the initial and final pressures equal. Similarly, the number of molecules won't change, since no air is entering or exiting. Using that, we can write the ideal gas law for the initial and final states, then set them equal:

What we're really interested in though is the change in volume, since that tells how much of a mess we're making:

We can plot this for a couple different initial volumes over the temperature range from refrigerator to heater-adjacent:

The green line is half full for my water bottle, and will spit out a couple tablespoons worth! As I write this, Marika is using the Instant Pot for some dinner prep – I'm surrounded by pressure vessels ready to blow!

Saturday, August 26, 2023

Head's Up

Recently, I saw my father-in-law Scott pour a bottle of beer into a glass, and I was fascinated by the relationship between the rising beer at the bottom, and the foam moving on top. I was curious if I could model the dynamics involved, so I decided to check if anyone else has tackled the problem. I found an article from a brewer discussing some of the steps involved, and I decided to split the process into 4 parts:

  1. For each bubble in the foam, apply forces from neighboring bubbles, and gravity pulling down.
  2. Drain liquid from higher to lower bubbles, based on the content of each. Bubbles at the bottom drain into the liquid beer.
  3. If neighboring bubbles each have low liquid content, merge them into a single larger bubble.
  4. Bubbles with low liquid and/or large size pop, adding their liquid to the beer at the bottom.
To represent these bubbles, we need to use sphere-packing to figure out how they fit in the glass. I've talked about the concept before, but since we're making a simulation this time, I found the package spack for Python. This handles keeping track of where the bubbles are, and can draw them for us. It also calculates the forces between the bubbles, based on their separation and radii.

To apply these forces, we need the mass of the bubbles – They're made of gas and liquid, but the liquid mass will far outweigh the gas. We're already keeping track of liquid content for the other steps, so we can use that for the mass and then displace each bubble based on the total force divided by its mass.

The spack package keeps track of which bubbles are adjacent – For each pair, we can drain liquid from the upper to the lower. The proportion I settled on was that at each step the lower bubble would get 51% of the total moisture, and the top one would be left with 49%. For bubbles with nothing below them, they drain the full amount to the liquid at the bottom. Similarly, we can use the adjacent list to pick bubbles to merge – Based on the article I linked above, I decided their circumferences would add, rather than areas. We select which bubbles merge based on their liquid content – Dryer bubbles merge more easily. Big, dry bubbles can also pop, giving up their liquid to the beer at the bottom.

We start off the simulation by filling the glass with a bunch of small bubbles, then let the rules outlined take over. I ended up using 1000 bubbles to start with, which takes a bit of time to get through, but I'm impressed with the results:

We can also measure some averages over the course of the simulation. First, we can simply count the number of bubbles:

The rate is fairly constant, despite the various dynamics going into determining the merging/popping. We can also look at the average size of bubbles:

I was a bit surprised by the sudden rise in the average size at the end, but I think it may be related to the merging of the bubbles: They get larger and fewer, resulting in a compounded effect on the average, and near the end, we have far fewer bubbles, making the average more sensitive to change. The average liquid content has a similar knee at the later times:

I have no idea how accurate this model is, but it does seem to follow the events outlined in the article: Bubbles merge, dry out, and pop, resulting in a shrinking head of foam, and growing reservoir of liquid at the bottom. Clearly I need to gather more data – Cheers!

Saturday, July 29, 2023

Birefringe Benefits

This week, I set a plastic container on our kitchen counter in the sun, and noticed an interesting effect:

The reflection of the sunlight off the counter gave a rainbow pattern. I recalled seeing a similar effect in demonstrations of polarized light. The stresses frozen into plastic cause a change in the light's polarization, which you can observe by putting it between two polarizing filters:

Wikipedia

I've mentioned polarizing filters before, in the context of reflection, but as I thought about this situation more, a problem occurred to me: The plastic is birefringent, which means it rotates the polarization of light passing through it, but the light from the sun is unpolarized, so rotating it should have no effect. The light only gets polarized afterward when it reflects off the countertop. To understand why, I have to get into the weeds a bit, so I suggest reading that earlier post I linked to before continuing.

Sunday, July 23, 2023

Oscillibations

A common question that arises for over-caffeinated physicists is, why does carrying a mug of coffee make it slosh over the rim? Ever since Marika got us our Apple Watches, I've been wanting to use the accelerometers in the watch, which allow it to measure your arm's orientation and motion, to record how my hand moves when walking with a mug. Sadly, I couldn't find an app that would allow me to download the data... until now! I recently decided to have another look, and found HemiPhysioData, designed to help people recovering from injuries track their progress regaining movement.

Accelerometers are a type of sensor that measure acceleration in a particular direction. A simple example is a weight on a scale: This measures a force, which is a mass multiplied by an acceleration. Typically these are used with just the acceleration due to gravity, but if you lift or lower a scale suddenly, you can increase or decrease the acceleration it reads. Inside the watch is a 3-axis accelerometer, which measures the acceleration through the face, top, and side of the watch. Using these measurements, it estimates a direction for gravity, since 9.8 m/s^2 is (hopefully) much more than an average person experiences otherwise. Subtracting that from the total acceleration gives just the wearer's contribution from moving around. We can also use it to find the orientation of the watch. All these measurements are spit out by the app as columns of a file:

  1. ID columns, giving info about the run
  2. Timestamp, measured at 100 Hz
  3. Roll/Pitch/Yaw Euler rotations
  4. Rotation vector x/y/z
  5. Estimated gravity x/y/z
  6. User acceleration x/y/z (total accel. minus gravity)
  7. Quaternion rotation w/x/y/z
  8. Raw acceleration x/y/z
The Euler, vector, and quaternion rotations are all methods for expressing the orientation of the watch. We can use these to rotate the user acceleration into the wearer's reference frame, rather than the watch's frame.

I decided to try comparing two runs: carrying an empty mug with a normal walking pace, and carrying a full mug being careful not to spill. Here's the output of the sensors for those two runs:

There's a clear periodicity to both datasets, but the differences between the two aren't clear. Instead of looking at the time-domain, we can look at the frequency spectra:

Now we can see that the empty mug has a few spikes between 4-7 Hz. If you look at Figure 5b in the paper I linked at the top, you can see this is the upper end of the frequencies that most excited the liquid in their mug. The paper points out that changing the radius of the mug will shift the resonance frequency, so the difference could be explained by the size of the mug.

The paper suggests a few methods for decreasing the risk of spilling, including dividing the cup into many small tubes, adding foam, or using a "claw grip", but I'll leave you with their comments on the suggestion of walking backwards to prevent spillage:

Of course, walking backwards may be less of a practical method to prevent coffee spilling than a mere physical speculation. A few trials will soon reveal that walking backwards, much more than suppressing resonance, drastically increases the chances of tripping on a stone or crashing into a passing by colleague who may also be walking backwards (this would most definitely lead to spillage).

Sunday, May 21, 2023

Stained Steel

This week I was taking a frying pan out of our dish rack, and it caught the sun, showing a surprising array of colors:

I wondered where these might be coming from, so I started reading about the makeup of stainless steel. I knew it was an alloy of iron and another metal – I thought maybe aluminum or tin, but it turns out it's chromium. The chromium reacts with oxygen from the air to form chromium (III) oxide, which protects the iron from forming iron oxide, or rust. If this layer gets damaged, a new one quickly forms. Heat makes the reactions involved happen more easily, so I wondered whether the color differences were due to greater heat in the center of the pan creating a buildup of the chromium.

I was able to find a paper analyzing the compositions that lead to different colors:

Figure 8

Using macOS's color meter, I was able to read the RGB values of the samples given. I plotted those to see if there were any obvious trends:

The blue seemed relatively linear, so I decided to use that as a link between my photo of the pan, and the composition data. I took the average of concentric circles outward from the center of the pan:

There does appear to be a downward trend in the chromium and oxygen fractions, which would be consistent with the heating idea, but there's an awful lot of noise, and the upturn at the edge. Part of the problem may be that lighting can have a big effect on color perception (I'm reminded of the dress from several years ago). The colors on our pan don't seem to match well to the scale used in the paper. In any case though, it was interesting to learn more about stainless steel, and know the colors are a sign it's working, not degrading!

Sunday, April 9, 2023

Anneal Before Zod

Almost a year ago, I promised to talk about annealing, and now I'm finally getting around to it! I mentioned that you might be more familiar with it than you think, and that's because it's behind something often referred to as the Brazil Nut Effect. I'm not a big fan of mixed nuts, but I do like granola:

Granola will typically have a variety of sizes of cluster, and shaking the bag causes the larger clusters to rise to the top. This happens because the smaller clusters can pack together more densely, and by having those lower in the bag, the system is in a lower energy state. What's interesting is how we got to that lower energy – By shaking the bag, we're adding energy. This seems counterintuitive, but it's the process behind annealing.

If we imagine a potential energy plot like the one I showed a few weeks ago, we can think about how to find the lowest energy state:

We could think about rolling a ball over these hills – We'd like it to settle in the lowest troughs, around 7.5 or 10, but it could get stuck in the ones at 2 and 13, analogous to the large clusters being stuck at the bottom of the bag. To solve this, we can give the ball a temperature, which represents an average velocity. By increasing the temperature, we can get the ball to explore the full range of states, then cool it down gradually to allow it to settle in the lowest-energy position. In the graph below, I've done this with several balls, initially spaced across the full range. The red line shows the temperature, which rises and falls.

A few balls still get trapped in the higher energy states, but the majority find those central troughs. Every time I shake a container to get things to settle, I think about this effect – Maybe now you will too!

Sunday, October 9, 2022

A Churning Ring of Water

[Title with apologies to Johnny Cash.]

The sink in our new home has an interesting setting that I was curious about:

It sprays a thin film outward, but the water curves back to meet in the middle again. When the water leaves the sprayer, there are only two forces acting on it: gravity pulling it down, and surface tension pulling the droplets together. I mentioned surface tension long ago, but I've never dug into the mechanics of it.

Surface tension is a force that acts to decrease the surface area of a fluid. For a given volume, a sphere has the smallest surface area, which is why water forms drops, and why shot towers can make round bullets. The magnitude of the force is given as

where γ is a constant that depends on the two materials being considered (air and water in this case) and L is the length of the edge that F will act to reduce. The sink is spraying out a ring of water, so if we take a cross-section, L is the inner plus the outer circumference of the ring. We can rewrite the force as

where m is the total mass of water, a is the acceleration, ρ is the density, A is the area of the ring, and Δh is the small vertical slice we're considering. Now this a refers to the radial acceleration of each water molecule, but we want to relate it to back to L. To do that, we can write two equations expressing L and A in terms of the inner and outer radii of the ring:

Since the ring is thin, we can take r1 approximately equal to r2, and after a bunch of algebra write

Since the flow of water is constant, A must be constant, so we can use the above equation to get a timeseries for L, then find r1 and r2.

In order to integrate this, we need initial values for L and Ldot. We can approximate the opening on the faucet to get r1 and r2, and find the initial L and the constant A. Then we can use A with the typical flow rate of 2.2 gallons/minute to find Ldot. Something didn't quite work out with my estimations, since the scale is way off in the following plots, but the shape matches great. Here's a side view of the spray:


and an animation descending through cross-sections:


So far I haven't found much use for this setting when cleaning dishes, but it did give me something interesting to think about!

Sunday, October 24, 2021

Mind Your Pizz’s & Queues

Most Friday nights, Marika and I like ordering pizza for dinner from our favorite Gainesville spot, Satchel's Pizza. Being a Friday night though, many people have the same idea, and we can often get stuck with long wait times. This past Friday, we decided to get our order in earlier, ended up getting in before the rush, and our pizza was ready sooner than we would have liked. This situation, strategizing our moves relative to others trying to do the same thing, reminded me of a project I was part of when I first started at the University of Michigan. It was in a parallel/sub-field to Physics called Complex Systems, where we try to apply techniques from Physics to other systems. In this case, we were looking at co-adaptation and co-evolution. Our model involved simulating a group of agents that would act on an environment with different strategies. Based on the strategy, they would change the environment, and get some benefit or penalty, then try to change their strategy for more benefit.

How does this relate to pizza ordering? The other customers and I are the agents, acting on the pizza place. We choose when to place our orders, and based on how many orders are ahead of us, it takes the pizza place a certain amount of time to prepare the order. We then change our ordering time according to how close to dinnertime our pizza finished. The adjustment I settled on was

This says we adjust our ordering time by 10% of the time between when we want to have dinner, and when we actually got our pizza. I put the 10% in there to make the transitions a bit smoother.

The pizza place I modeled as a set of ovens and a queue. When a customer orders, they're added to the queue, and each empty oven will serve the first customer in the queue, and take 20 minutes to cook the pizza before becoming empty again. I was curious how the customers would change their order times, and what kind of wait times would be involved. I decided to run the simulation with a couple different numbers of ovens, and see how things changed. I decided all the customers would try to eat at time t=0, and use t=-20 minutes as their first order time. Here are the average order times used by the customers at each iteration:

After some initial transients, each of the oven cases settles into a sinusoidal pattern, but with different amplitude and frequency. We can also look at how far off the customer was from their dinnertime:
A couple weeks ago was Homecoming weekend, and the wait times did indeed get into the 2 hour range! Where these results get really interesting is if we combine the previous two plots into one showing the relationship between the order time and the wait time:

This has the appearance of an attractor, a common feature of complex systems, where the state will trend toward an equilibrium point, but not necessarily reach it. This is the average over all the customers though, so we can also look at the individuals over time:

It seems the other Satchel's customers and I are trapped forever in a cycle of never getting our pizza quite when we want it!

Sunday, August 15, 2021

The Terror of Knowing What's Inside This Pot


Marika and I recently got an Instant Pot pressure cooker, which we've been enjoying making meals with. Naturally, I was curious about the inner workings of the pot, specifically how the temperature and pressure inside vary with time.

The concept behind a pressure cooker is that when cooking food in water, you typically can't heat it beyond the boiling point: Once the water reaches boiling, any energy you add just goes into making steam. Sometimes you want to cook things at higher temperatures, which is why frying uses oil. That's not very healthy, though, so it would be great to raise the boiling of water. You can do that a little bit by adding salt, which is often suggested for pasta, but that doesn't go quite far enough. Instead, you can put the water under pressure, which raises the boiling point.

A pressure cooker is a sealed container that you add water to, and then heat. As the water evaporates, the pressure builds inside the cooker, raising the boiling point. The pressure depends both on the temperature of the steam, and the number of water molecules that have evaporated:
This is the ideal gas law, with T the temperature in Kelvin, V the volume, R a constant, and n the number of moles of gas molecules. A mole is a way to count very large numbers of things, equal to Avogadro's number, 6.022 * 10^23. My grandfather, a chemist, used to say that he and my grandmother had "Avogadro's Anniversary", because they were married on 10/23.

In order to add molecules to the steam though, we need to boil the water. The temperature that water boils at will change as the pressure increases. Even after we get to boiling, we need to overcome the latent heat to get the water out of the liquid phase and into steam. To accomplish either of these goals, we need to add energy to the system, which translates into temperature through the heat capacity.

Putting all this together with the specs of our model, we can look at the temperature and pressure for two cases: The minimum amount of liquid in the pot, 2 cups, and about half-full, 12 cups.


I was surprised by how quickly the pressure rises once we hit boiling – I kept a constant amount of power throughout the calculation, which causes the pressure to quickly exceed the working range of the pot. You can see the extra energy being used to push more molecules into steam in the sudden change in slope of the temperature plots.

I was hoping that by studying pressure cookers a bit more closely, I'd find them less terrifying to use, but I'm not sure these results are very soothing! I'll just have to keep singing to myself, "Mm ba ba de, Um bum ba de, Um bu bu bum da de..."

Sunday, February 14, 2021

Carbon Catch-and-Release

Around 15 years ago, my father Steve and I were browsing in T. J. Maxx (which I'll forever think of as "Temporal Jail: Maximum Security" thanks to Jasper Fforde) and came across a soda siphon, aka the seltzer bottles that seem to only appear in old movies for comedians to spray each other with. We decided to buy one, and we've continued using them to this day (after spraying each other with it a couple times, naturally).

If you've ever seen one used, the force of the water when it sprays out is impressive, and I was curious if I could derive how fast it's moving. In looking for an answer, I found the Hagen-Poiseuille equation, which relates a change in pressure to the flow of a liquid:

where μ is the viscosity of the water, L the length of the pipe, Vdot the volume flow rate, and r the radius of the pipe. The pressure difference is simply the pressure we add when we charge up the bottle. The CO2 cylinders that go in the bottle (yes, we buy 100 at a time) hold 8 grams of gas each, to charge 1 liter of water. To find the pressure that results in, we can use the Ideal Gas Law:
where n is the number of moles of gas, R is a constant, and T is the temperature. We can get the number of moles from the molar mass of carbon and oxygen. Putting everything together, and solving the differential equation gives
where Vtot is the total volume of the bottle, and V0 is the initial amount of water. I tried plotting this, but I was having some trouble with the units – I think I missed a factor of 1000 somewhere between the millipascals, (kilo)grams, and centimeters. I wound up fudging it to get more reasonable results:
This says that the bottle will be empty in about 8 seconds (and probably not 8 milliseconds, as I initially calculated). For the velocity we get

For reference, 1 cm/s at the top of this graph is about 2 feet every minute, which is way too slow, but leaving in the factor of 1000 is way too fast! I'm not sure where I went wrong with this, but it may be that the Hagen-Poiseuille equation is not the right one to use here – Wikipedia says it "describes the pressure drop due to the viscosity of the fluid", and so it may not apply to the flow due to the difference in pressure. Oh, well – Another of Nate's "that didn't work!" posts.