Pages

Showing posts with label Weather. Show all posts

Sunday, January 26, 2025

Water Wedge

The streets around our house have many potholes, which fill up with ice:

Water expands when it freezes, which means when a hole fills with water that freezes, the ice can potentially make the hole bigger. To do this, the ice puts pressure on the asphalt, and vice versa. Adding pressure can make it more difficult for ice to freeze, so I looked up some info on asphalt strength. This paper gave a plot comparing the bond strength for different aging times:

Figure 8

These are all around 2-4 MPa. We can look at the phase diagram for water to see how this would affect freezing:

Wikipedia

This is well within the range where the freezing point is still around 0°C, so we don't need to worry about the pressure we're applying. Water expands by about 9% when it freezes, so we can imagine water filling a crack, then pushing out in all directions:

That's the general idea I had in mind, but getting into the details, the steps I used are

  1. Begin with a flat road. Put a dent in the center with depth y0 (*parameter).
  2. Find all points below the road, and use them to define a polygon.
  3. Find the centroid (center of mass) of the polygon and push all points out by 9%.
  4. Push the polygon down according to its weight (*parameter).
  5. Add points anywhere the separation has passed a threshold.
  6. Adjust points along line for equal spacing.
  7. Repeat from 2.

I added steps 5 and 6 since otherwise the crack just scaled up from the initial dent. We can look at the type of crack these steps give as we cycle through freezes/melts:

This seems a little extreme, but we can take a look at how this changes with the two parameters I marked above. The two qualities I was mainly interested in were the width and depth of the crack. We can see how those change in time with different y0 and weight values:

It makes sense these curves look exponential, since the increase depends on the current size. What really surprised me though was how well-separated these two qualities are according to the input weight and y0. These plots suggest that the width is almost wholly determined by the weight, and the depth by the initial depth. For the depth, this can easily be tied to the exponential behavior – Starting deeper increases the rate the depth increases. A little less obvious is the weight, but if we look at the initial diagram of the setup, the wedge shape of the ice means pushing down also pushes out. A quality of exponential systems is that they can very quickly get away from their starting point if left unchecked – A reminder to keep those roads smooth!

Sunday, January 19, 2025

Beet the Traffic

We watch the local news every morning, and this week a story caught my interest: Alternatives to using road salt to avoid harmful risks. The key point of the story is that runoff from salting the roads can damage the surrounding environment, but adding beet juice to the solution can make it stick to the roads better. Reading up on the idea, I've found it's still debated whether this idea is really better for the environment, but the bit I was curious about is the ability to stay on the road.

Looking into ways I could model this, I found a paper discussing how droplets spread over time based on their surface tension. Their model was a bit more involved than I wanted to get, so I made some simplifications: The droplet takes the form of an ellipsoid with constant volume and circular base. This constrains the relationship between the height and the radius. The paper defines a value they call h* where gravity and surface tension balance. After my simplifications, it takes the form

where ρ is the density of the fluid, g is the acceleration due to gravity, and γ is the surface tension. For a given fluid, we can look up the surface tension and density. I decided to try a salt-water solution (γ, ρ), a sugar-water solution (γ, ρ), and molasses (γ, ρ).

The paper gives a t^1/5 form for the height of the drop, so we can start each of these fluids as a hemisphere and see how they spread as they approach their respective h* values:

This shows the sugar and salt spreading at roughly the same rate, contrary to the idea given in the report, so I expect my model is not capturing all their qualities. What I find really interesting though is that the thicker molasses actually spreads faster, because it's more dense that the other two, so gravity exerts a stronger force. Naturally, this brought to mind a bit of history from my home state, when a flood of molasses from a ruptured tank cut a swath of destruction through Boston!

Saturday, June 22, 2024

Ozoning Regulations

Recently our local news in Michigan issued an air quality alert, which mentioned an increase in ozone levels. I was curious about this, since I know the ozone layer protects us from harmful UV light, and the hole over the South Pole is a major environmental concern. That hole was caused by certain pollutants, so I was surprised to hear increased ozone also being associated with poor air quality.

The key is where the ozone is in the layers of the atmosphere. The ozone layer that protects us is in the Stratosphere, while the one associated with poor air quality is in the Troposphere:

Wikipedia

The majority lies above 15-20 km and absorbs 97-99% of the UV light that comes from the Sun. The ground-level ozone results from byproducts of burning fossil fuels. Since ozone is made of 3 oxygen atoms, rather than the 2 that make up oxygen's breathable form, it's heavier, and so I wondered about the process that keeps it at those high altitudes. It turns out it's a continuous cycle, in which oxygen atoms bond and unbond in different configurations. The process is mediated by UV light, which is absorbed by ozone to break it into gaseous oxygen. Since it's absorbed up there, it doesn't make it to the troposphere to break up the ozone down here (or damage our DNA, so overall plus).

The benefits of ozone in the upper atmosphere, combined with its dangers in the lower atmosphere made me wonder if there were a way to transport it upward. Other people have wondered that, and unfortunately it doesn't work. Since ozone is heavier than oxygen, it won't naturally rise, and we'd need to carry it upward. That has its own problems though, since ozone corrodes many materials, so it would get expensive to keep making new containers. The other problem is that there just isn't a lot of ozone down here compared to what the upper atmosphere holds. It would be difficult to collect enough to make the process worthwhile. It seems our best bet is to stop making ground-level ozone in the first place, and to keep the upper-level ozone doing its job!

Saturday, June 24, 2023

Hail! Hail! To Michigan!

[Title from the University of Michigan fight song, which Steve couldn't stop singing when I was accepted to the graduate program.]

A couple of weeks ago, we had a sudden hailstorm while I was cooking dinner, and the kitchen skylight made some incredible (and alarming) sounds:

I started to wonder whether I was in danger of being showered with glass, and while the skylight (and I) survived the storm, I thought I'd take a look at what the chances were for future shattering.

Hailstones can form in tall thunderclouds with lots of air movement, where water drops can rise into cooler regions and freeze, then fall partway to collect more water. This repeats several times before the hail falls. If it falls far enough, it will reach terminal velocity, the speed at which the force from gravity pulling down balances the air resistance slowing it down:

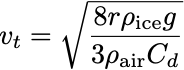
where m is the mass, g the gravitational acceleration, ρ is the density of air, A is the cross-sectional area of the hailstone, and Cd the drag coefficient, which depends on the shape of the object. Since I'm a physicist, I'll assume the stones are spheres with uniform density. Then we can express the mass and area in terms of the radius of the hailstone, and use the tabulated value for the drag coefficient:

Plugging these into the velocity equation above, we find

I wanted to check whether this was reasonable, so I found a paper from the University of Wyoming with this plot:

Figure 1

If we plot our function over the same range of diameters, the velocities match incredibly well, given the simplifying assumptions we made:

Now that the velocity is settled, we can look at how much energy the hailstones carry. Kinetic energy uses both the velocity and mass to give

So now the question becomes, at what point is this large enough to break glass? Lucky for us, a student at the CUNY College of Criminal Justice wrote their thesis on shooting BBs at windows!

Table 2

This gives the minimum energy for damage as around 2 kJ. We can plot energy vs hail size and see how big the stones have to get:

According to this, the glass will start to be damaged at a diameter of about 140 mm, or the size of a softball! At that point, I think there may be more to worry about than just the skylight.

Sunday, February 5, 2023

Chilling Reports

This weekend, Mt. Washington in New Hampshire set a record for the lowest measured wind chill. I've always been a bit bothered by the idea of wind chill, since it doesn't represent what temperature it is, but instead what temperature it feels like, which seems a bit subjective. I thought I'd take a closer look at how wind chill is calculated.

There are several different models for calculating wind chill, but the principle is the same: In calm conditions, a boundary of warmer air will build up between your body and the colder air, which will slow the heat loss, but strong winds will replace that boundary with the cold air, cooling you faster. In spite of this faster cooling, you'll never get colder than the actual temperature of the air, so if you sit on top of Mt. Washington you can rest assured you won't go all the way to -108°F, but instead stay at a balmy -47°F.

Thinking about it a bit more, I suppose my real problem with wind chill is that it's using the wrong units for what it's measuring: Wind chill is meant to convey the rate of heat loss, so that's how it should be measured. That's what the original model, called the wind chill index, measured with units of kilocalories/hour/meter^2. What's nice about this is that you can clearly see that your total energy loss will depend on how long you're outside, and how exposed you are.

If you look at the Wikipedia page above, you can see the different equations for the wind chill index and the wind chill temperature. On the surface they look similar, but the wind chill temperature has a very unusual 0.16 power, which only makes me more uncomfortable with the measure. We can look at how the two compare for a range of temperature and wind speed values:


The shapes are similar, but the wind chill index has more of a bulge, indicating that it is more sensitive to the wind speed than the wind chill temperature.

The Wikipedia article states "Many formulas exist for wind chill because, unlike temperature, wind chill has no universally agreed upon standard definition or measurement. All the formulas attempt to qualitatively predict the effect of wind on the temperature humans perceive." It seems a bit silly to tout a record based on an arbitrary perception of temperature – Ever since chemo, I've found myself more easily chilled than I used to be, so maybe I'll define my own wind chill measure: The usual wind chill temperature, minus 5 degrees. New record set!

Sunday, September 26, 2021

Cyclopian Cyclones

For the past 2 weeks, I've been struggling with a question from Papou, as well as struggling with a stomach bug which probably didn't help, but I finally have an answer! Papou wondered, How does the Coriolis affect hurricanes in the northern hemisphere and what is the percentage centrifugal velocity increase/decrease at the eight points on the compass assuming the hurricane is moving directly East to West?

Coriolis force is one of the fictitious forces that appear in a rotating reference frame, along with the centrifugal and Euler forces. If you look at articles on why hurricanes spin the way they do, they'll give explanations about how the speed of the Earth's rotation varies depending on how close to the pole you are, which causes the Northern edge of the hurricane to be pushed one direction, and the Southern edge pushed the other way. This explanation makes sense, but it didn't fit with my algebraic understanding of the Coriolis force.

If you look up the equation for the Coriolis force, you'll see it stated as

where Ω is the angular velocity of the rotating frame (for Earth, 2π/day), and v is the velocity of an object in the rotating frame. You may notice, there's no mention of radius here, which is why I was confused by the articles I was reading.

I decided to follow the default route for Physics: Simplify until things make sense! Let's imagine a hurricane directly over the North Pole. A key feature of hurricanes is the eye, which is a region of low pressure at the center. Low pressure in the middle means air will tend to flow from the outside in. As that air accelerates though, it will have a velocity perpendicular to the angular velocity, which is pointing straight up in this case. That will cause the Coriolis force above to push the air in a counter-clockwise direction, exactly what we're expecting.

I tried to put together a full simulation of the pressure difference driving the air inward, but then being balanced by the Coriolis force spinning it in a circle. Unfortunately, I couldn't come up with a model of the pressure that didn't vastly overpower the Coriolis force, so I ended up simplifying things a bit more: We assume the pressure difference causes a constant force inward, and then see how that changes under the effect of the Earth's rotation vector, projected into the local plane of Florida (27.7° N latitude):

For this simulation, I used a diameter of 300 miles and a Category 3 windspeed of 120 mph, but again, I had to fudge a bit to get things to work.

As for the second part of the question, centrifugal force doesn't really come into things here. For most places on the Earth, centrifugal force points upward, so its only effect on the hurricane would be a vertical circulation of the air. That may have an effect in reality, but I'm only considering a 2D model here, so it doesn't really apply.

I always have a hard time picturing these 3D systems, with interacting vectors and different reference frames, but I hope I've given a reasonable explanation for how these types of weather events form. I'm betting there's a way to connect my understanding of Coriolis forces to the one commonly given, but I can't puzzle it out. Thanks for another great question, Papou!

Sunday, July 12, 2020

Anna, Mom-Eater!

While watching the morning news recently, I noticed their graphic of a wind gauge during the weather segment:
Wikipedia
Initially, I imagined the cups were moving at the same speed as the air, but then I started wondering about how the backs of the cups would slow the rotation – The wind is pushing on both sides, so how much gets cancelled?

The key is that the cup's drag coefficient changes as it rotates. This coefficient is defined as
where F is the force applied to the cup, ρ the density of air, u the speed of the air, and A the area of the cup facing the wind. Wikipedia gives the drag coefficient for the outside as 0.38, and the inside as 1.42. To get the area of the cup we need, we can use the same type of stereographic projection from an earlier post. In theory, the drag coefficient would change continuously as the cup rotates, but we can get an approximation by assigning the inside/outside coefficients to the inside/outside area projections. Putting everything together
This is just for a single cup, so now we turn to the full anemometer design. Initially, they were built with 4 cups at right-angles, but these have mostly been replaced by 3 cups at 120° angles. I decided to try both:
The Wikipedia article I linked to above says, "The three-cup anemometer also had a more constant torque and responded more quickly to gusts than the four-cup anemometer." My model doesn't show this, with the 4-cup design (red) giving less variation in force, and a larger mean force. I imagine this is due to the drag approximation I mentioned, which leads to the sharp knees in the plot above.

Sunday, January 26, 2020

Sknowflakes

For a moment it seemed like things were warming up here in Michigan, but we're back down to freezing again, and it's got ice crystals on my mind. Specifically, I was curious if I could model snowflake growth programmatically. I found this paper, which describes a simple technique from Stephen Wolfram (of Mathematica fame):

  1. On a hexagonal grid, mark one cell as "frozen" (1) and all other cells as "unfrozen" (0)
  2. Any unfrozen cell with exactly one frozen neighbor gets marked as frozen
  3. Repeat until the grid is full
I found the simplicity of this appealing, and I thought I'd try it before attempting the more complicated method the paper describes. Unfortunately, even this simple idea caused me no end of problems, due to the hexagonal grid.

We want to assign coordinates to each hex in the grid, which isn't too difficult:


The trouble comes when we want to find the neighbors of a particular cell. Depending on the row, the relationship changes. If you look at the cells around (2, 7) the one to the upper right is (+1, +1), but for (7, 4) the upper right is (0, +1).

Aside from that difficulty, I also misremembered the sides of a 30-60-90 triangle, but once Sally gave me a gentle reminder, I was all set!


I had hoped I could get different patterns by changing the initial set of filled cells, but it turned out the same shapes would establish themselves pretty quickly. Now that I have the hexagonal grid code sorted out, maybe I can come back to this in the future and try the more complicated models.

Sunday, December 1, 2019

Hysterainy

I've been enduring a lot of rain lately, both in Italy, and now back in Annecy. I'm always frustrated by intermittent rain, since I have to wonder whether it's worthwhile to open/close my umbrella when the rain starts/stops. Whenever I start thinking about it, I'm reminded of the idea of magnetic hysteresis. This is the tendency of magnetic systems to "remember" the state they were in earlier, even when outside conditions change.

The classic model system for this is the Ising model, which I discussed in an earlier post. The difference here is that we vary the external field and see how the system's internal field reacts. The typical plot looks like this:
Based on Wikipedia
On the x-axis is the applied external field (how much it's raining), and on the y-axis is the field within the system (how likely I am to have my umbrella open). Starting in the center, with both fields zero, we slowly increase the external field, which brings the system along with it. When we decrease the field though, the system lags behind, still giving a positive field when the external one is negative, just like keeping my umbrella up while it's not raining.

I decided to adapt my previous Ising script to try to demonstrate this effect, and I was surprised by my success: Hysteresis.py


On the left is the grid of magnetic spins, which interact with their neighbors and the external field. On the right is a plot of the external field vs the average field of the spins. Aside from the weird jiggling frame I couldn't get rid of, it matches the model above pretty well!

Marika and I are packing things up to return to the States in a couple weeks, so I may miss posting.

Saturday, November 9, 2019

A Bolt of Cloth

The past couple weeks here have been non-stop drizzling rain – not the nicest farewell I could have – but it reminded me of a post from another of my favorite blogs, Futility Closet.

Wikipedia
Shortly after Benjamin Franklin created the first lightning rod, the idea caught on in Europe as a fashion accessory. There were umbrellas fitted with lightning rods (above), as well as hats, which trailed a wire for grounding. The information on these is a bit sparse, in particular whether they had ever been tested. This concerned me, since I saw some potential problems with the design, which I thought I'd explore today.

First, a quick explanation of how lightning rods work: During thunderstorms, charge collects in clouds. If enough charge builds up, it can overcome the resistance in the air, and create a channel down to the ground, where it discharges. This is lightning, which can carry lots of charge at high speed. Electricity takes the path of least resistance, and since humans and animals carry a lot of salty water, that makes us appealing routes to the ground. Tall buildings can also make good conductors, but since lightning carries so much energy, it can start fires. To protect ourselves, and our homes, we can make even better channels by topping buildings with a metal rod that connects directly to the Earth through a wire. Based on this, the lightning rod apparel doesn't seem unreasonable, but let's look at some issues.

Ground Current
For real lightning rods, the grounding wire is buried several feet deep to better distribute the charge, but that wouldn't be possible with a rod you carry with you. Instead, the wire just drags behind you, but that's no different from lightning striking the ground near you. Lightning carries a lot of charge, and it takes some space to dissipate, which can be just as dangerous as the initial strike. The National Weather Service webpage illustrates this with a charmingly-90s, yet still horrifying, animated GIF:


According to the Washington Post, ground current can be dangerous as far as 60 feet from the initial strike, so you'd need an awfully long tail on your umbrella/hat, not to mention the danger to anyone else who happens to be near the contact point.

Melting Wire
Since these are fashion accessories we're talking about, the Wikipedia article above mentions that the grounding wire was silver, but that could get expensive. One site I found lists the gauge for a grounding wire as 2 AWG, or about a quarter inch. There's also the problem that silver has a lower melting point than copper, 961.78 °C. That made me curious whether you'd be trading electrocution for being sprayed with molten silver.

The energy absorbed by the wire will be
where I is the current, 𝜌 is silver's resistivity, l is the length of the wire, A its area, and t is the duration of the strike. Using those values, along with a normal (rather than rope-sized) silver chain, and a height of 1.8 meters, I come up with 195 Joules, which is nowhere near enough to melt even a thin chain.

Magnetic Field
So at this point, you're still dead from the ground current, but your relatives will be able to salvage your silver chain. What about your smartphone? When current flows through a wire, it produces a magnetic field, according to

I couldn't find info for smartphones, but according to this site, credit cards could be damaged at a distance of 63 centimeters, and pacemakers at 25 meters! I'm not sure whether the short duration of the bolt would change these calculations, but it still doesn't seem like you or your electronics would be safe in a thunderstorm, even if you are wearing the height of 18th century fashion.

Big thanks to Futility Closet for pointing out this fleeting trend! I'm sure we would never use new technology in such a frivolous way, right?

Saturday, December 17, 2016

A Long Haul


We've already had inches of snow building up in Ann Arbor, making it a little more difficult to get around, and it got me wondering about snow removal in a city.  For large snowfalls, there isn't really room for big piles, so the snow would need to be hauled elsewhere.  How much cheaper is that than melting the snow with, say, blowtorches?

Melting snow involves overcoming the latent heat of the ice crystals.  This is the energy contained in the crystalline structure – I've mentioned this property before in the case of candle wax.  If we assume the snow is already at the melting point of 0°C, then we still need 334 kJ of energy per kilogram of snow.

Figuring out the energy needed to move the snow is a little more complicated, since it involves converting the gas mileage.  Current semi trucks get about 6.5 mpg with diesel fuel.  Diesel engines are relatively efficient (though they produce nastier byproducts), converting about 45% of the chemical energy into mechanical work.  The final piece we need is the amount of energy in a given volume of fuel, 35.8 MJ/L.  Putting these together, we can find the energy needed to move a truckload of snow a given distance: 2.16 x 10^-5 miles/kJ.

The maximum weight this truck can carry is 80,000 pounds, so we can calculate the energy to melt that much, 1.21 x 10^10 Joules (not jigawatts, sadly).  So how far would we need to haul the snow to make it more efficient to melt?  26 million miles, or several trips to the moon and back, but only 1/5th of the way to Mars.

I wasn't expecting to have a breakthrough snow removal technique, but this does seem a little high.  It's possible I'll find a mistake later, so take these results with a grain of salt (yet another snow-removal method).

Correction: I left out a factor of 10^-5 in my calculation above.  The actual distance is 262 miles.  Thanks, Kevin!

Saturday, November 5, 2016

The Living Daylights

Last weekend, I was doing some research work on a computing cluster in Germany, and the time stamps suddenly jumped by an hour – Turns out the EU changes from daylight saving time on the last Sunday of October, rather than the first Sunday of November.  I had been under the impression (along with many others) that DST was introduced for the benefit of farmers, but they actually lobbied against it.  The original intent was to give more daylight after the work day, to encourage people to shop.  I thought I'd take a look at how this idea lines up with the sunrise/set times from the US Naval Observatory.  Here are the times using standard time all year:


The black lines show my usual wake/sleep times.  Now if we introduce DST:


By using DST, I'm awake during more of the daylight.  This is the rationale behind one of the other arguments for changing clocks – energy savings by reducing light/heat use.  It's easier to see if we look at the overlap between waking and daylight in the two systems:


The idea that DST saves energy is disputed though, and a number of studies have not shown a conclusive benefit, so it's likely a small effect if any.  Seems likely to stay though, since getting rid of DST would take more effort than it costs to keep around.  I'll just have to keep a close eye on my foreign time stamps.

Sunday, October 2, 2016

Precipitous Power

We've been getting a lot of rain here in Ann Arbor the last few days, and it reminded me of a question I've often wondered after being hit in the head by a particularly large drop: How much power could you generate from rainfall?

The kinetic energy of each drop is
where m is the mass and v is the velocity when it hits the ground.  Clearly we need some statistics about raindrop size; a quick search turned up this paper, from a collaboration between Brookhaven National Laboratory and a group of Chinese institutions.  The important info we need is in Fig. 5:
The y-axis, volume-mean diameter, refers to the diameter of a perfect sphere with the same volume/surface area ratio as the drop.  Coincidentally, this is also known as the Sauter mean diameter.  Unfortunately, the paper doesn't provide a fitting function for these curves, but we can take a guess, estimating values from pixels:

xy
1.1498257840.8509578544
3.0662020910.9689655172
4.9825783971.078544061
7.8571428571.137547893
13.797909411.230268199
27.212543551.348275862
48.675958191.390421456
I chose the convective points for their larger range of rates.  Based on those, I asked R for a log fit and got this, with an R-squared of 0.992:
The relationship between mass and diameter is
where ρ is the density of water.  We still need to find v, but if we assume the drops hit terminal velocity for a sphere, we can use eqn 3 from this paper:
where g is the acceleration due to gravity, and I've substituted in the drag coefficient for a sphere.  Putting these together, the energy becomes
This is the energy of each drop, so we need to multiply by drops per time to get power.  The drops per time is related to the rain rate from above:
where A is the collection area.  Putting everything together, we have
If we plug in values, this comes to

At the highest rain rate from the paper, this comes to 0.081776 Watts per square meter, while solar cells can put out a couple hundred Watts per square meter, so maybe not the solution to our energy problems!

This one wound up being a bit dense, sorry.  I'll try to pick a more accessible topic next time!