Pages

Showing posts with label Games. Show all posts

Sunday, September 24, 2023

Losing My Marbles

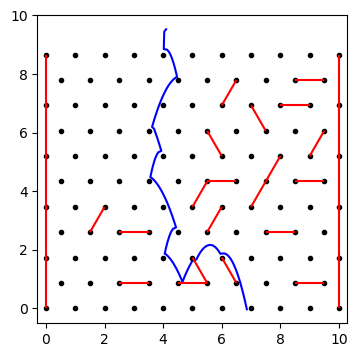
Next week, Marika and I will be flying to Massachusetts to visit my parents, and receive the generous gift of their camper van! Our trip happens to overlap which a favorite event on my childhood, the Ashfield Fall Festival. It includes local art, music, and cooking, but I was always more interested in the games. There was the usual tipping ladder, but my game of choice was the marble rolls. These were made from boards tipped at an angle with a grid of nails pounded into them. Rubber bands were stretched between nails in a pattern so that a marble dropped from the top would bounce off the nails and bands until it landed in one of the slots at the bottom. Different slots were worth different points that would determine your prize. I've now been studying physics for half my life, so I thought I could look at the game not as lottery, but as a deterministic physical system, and maybe win myself some grand-prize trinkets on this trip!

As the marble rolls down, it hits nails and bands that change its direction. Physicists typically look at collisions from two extremes: elastic and inelastic collisions. In both cases, momentum is conserved. For elastic collisions, energy is also conserved, but inelastic collisions in which the objects "hit and stick," or finish with the same velocity, lose the most energy possible while maintaining momentum conservation. For collisions between our marble and the nails/bands, the velocity we care about is only in the direction connecting the two objects: both collisions will stop the marble from going through it, but keep the component of velocity perpendicular the same. For nails we'll use inelastic collisions, which simply stop any motion through the nail, and for rubber bands we'll use elastic collisions, which reverse the direction.

I wrote some Python code to simulate this, randomly choosing pairs of adjacent nails to stretch bands between. Checking when the marble hits a nail is pretty simple, since we can just get the distance between the points and see if it's within the radius of the marble. The bands are a bit more involved: we have a line segment between two points, and need to know the distance to a third point. The closest point on the line segment will be on the perpendicular that passes through the marble's center (proof left as an exercise for the reader, heh). I ran into a couple edge effects in the simulation, where the marble would get sort of "hooked" on one of the nails, but overall I'm pleased with the results:

Now that we have this basic framework, we can generate a board, then map out the landing positions for all the different starting points. I decided to make a sort of flip-book with different numbers of bands, randomly chosen. The starting positions are shown by different colored lines, and the bottom of the plot shows a histogram of where the marbles land.

I couldn't figure out a good way to get statistical measures, but it's interesting to see the gaps just below bands where no marbles pass through, and to see cases where a marble starting on one side of the board crosses to the other side. The 0-band case has a nice symmetry to it, and some of the middle ones look a bit like Jackson Pollock paintings, but the important part is, with this on my side, that plastic lobster harmonica is mine!
Sunday, November 6, 2022

In My Corner

For a while I've been interested in analyzing the game Jenga, since it's very physics-aligned in its design: Maintaining balance under changing forces. I couldn't get a handle on how to look at it though, until I connected it to a tool that's used frequently in my research field: corner plots. Corner plots are a way to display correlations between different variables in a large data set. For gravitational waves, they're used to show how estimates of a source's parameters depend on each other, such as a black hole's mass and spin. I figured I could come up with some measurements of Jenga games, and look at how they relate to each other.

First, we need a way to collect some data. As a reminder, here's what a Jenga tower looks like:

Wikipedia

Each level has 3 blocks that alternate in direction. On a turn, we remove a block from anywhere below the top level, and then add it to the top. The tower will fall and end the game if the center of mass of a subset is over an empty space, and the side is not supported. I was able to make a simulation of this in Python, with the virtual player making a random move on each turn, so long as that move does not cause the tower to fall. Eventually, the player will run out of moves and the game will end, but we can look at what kinds of moves result in longer games. I struggled a bit to find a way to show an example tower being built, and settled on a side view with all the bricks facing out. Remember that the bricks actually alternate in direction, so a hole under a brick is not necessarily a problem:


Now to get our statistics, we want to run a large series of games, and get some measurements from each one. The parameters I chose were max height of the tower, number of turns taken, fraction of turns for which the center block of a level was removed, fraction of turns a block was placed on the center of the top, and the fraction of times a block was removed from the upper half of the tower. After running 500 simulated games, we can make a corner plot with the results (click to enlarge):

This shows us some interesting connections between our parameters. There is strong correlation between the maximum height and the number of turns – This makes sense, since each turn we put a brick on the top level. We can also see anti-correlation (negative slope) between removing the center brick and max turns/height. This is because once the center of a level is taken, we can't take either of the sides, so we run out of bricks faster. Our final two variables, adding to the center and removing from the upper half, don't seem to have much effect on the outcome, indicated by the circular distributions.

Now in reality, Jenga bricks are designed with some irregularities to make the balance a little more difficult to predict, so this is another case where knowing the physics might not help you win, but it was interesting way to explore a tool for visualizing data.

Sunday, June 12, 2022

The Great Mubbet Caber

I may have mentioned before that I'm a big fan of the British quiz show QI. A recent episode included a discussion of an event from the Scottish Highland Games, the caber toss. In the sport, competitors must throw what amounts to a tree trunk such that it flips end-over-end and lands pointing as straight as possible away from them. You can see a video with some examples here:

I was really curious about the physics involved in determining a successful flip. I decided to make a simplified model of the sport: The competitor holds the caber at an initial angle θ, measured from the horizontal behind them. Then they run forward up to a speed v, and stop, exerting a torque on the end of the caber. It continues forward, while beginning to spin. When one end touches the ground, it sticks, and then the initial speed and gravity determine which direction it falls.

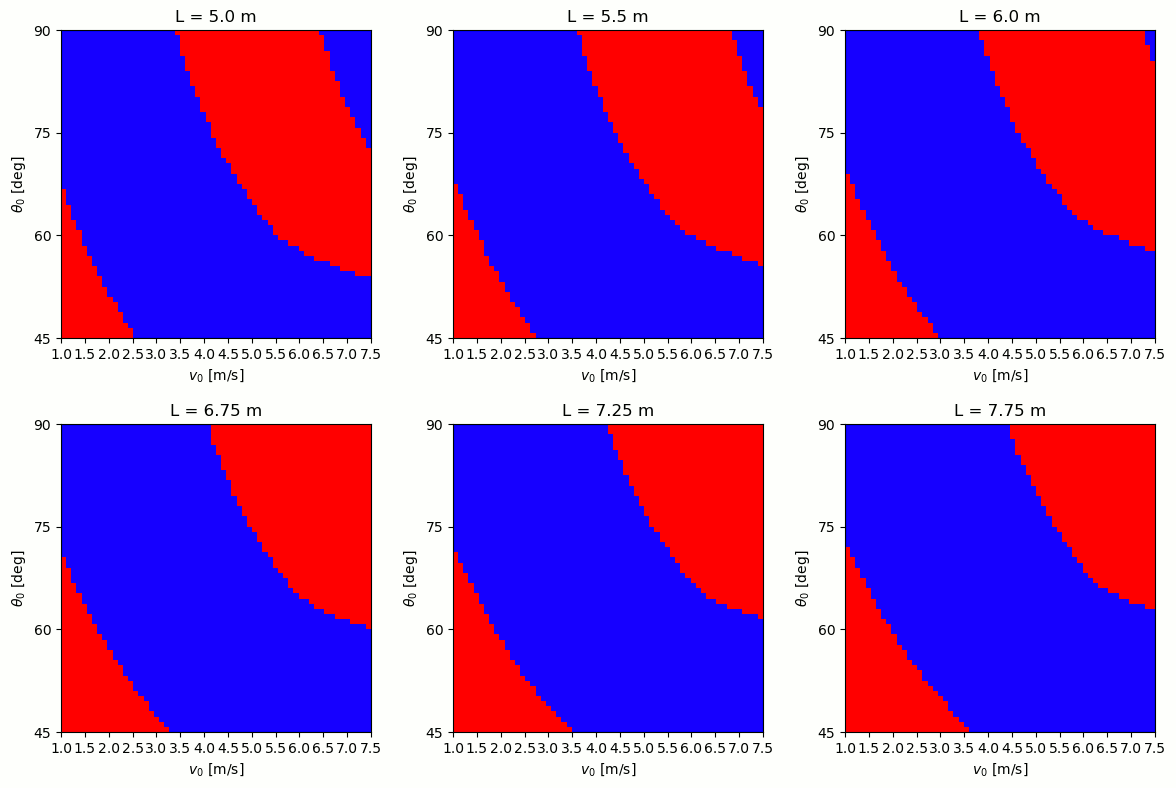
Based on the Wikipedia article I linked above, I tried a range of different lengths (5-7.75 m), angles (45-90°), and initial velocities (1-7.5 m/s or 2-17 mph). For each case, I ran the simulation and tested whether the caber fell away, or back toward the athlete. The plots below show the results, with blue indicating success, and red failure. As the length changes, the successful ranges shift, and for the shortest cabers they can even flip twice (blue region in the upper right)!

For the longest case, I also animated the throws for the 4 corners: min/max speed and angles:

As with many of these posts, I'm not sure understanding the theory would make me any more able to compete, but I'm content to use my imagination!

Sunday, May 29, 2022

You Remind Me of the Babe

Recently, I was reminded of a toy my grandparents had when I was growing up, a marble maze like this one:

Amazon

Turning the knobs tilts the board, causing the marble to roll. I was curious if I could find the fastest possible path through the maze. The key is that the tilt of the board limits how much acceleration you can apply, which in turn limits the speed with which the ball can navigate turns.

Since hitting walls would introduce sharp changes in velocity, which makes things difficult to optimize, I decided to simplify the problem by leaving out the holes, and penalizing any path that passes through a wall – With a high enough penalty, the optimum solution should not allow any Kool-Aid balls.

The first problem to solve is representing the maze, and a path through it. I found a Python package that handles both of these, pyamaze. This package can generate a maze on a grid of squares, and give the series of points leading from the start to the finish. To go from these points to a continuous path, I decided to use spline curves. These are a technique for generating a function that passes smoothly through a given set of control points. By moving each control point around inside its square, we can try to find the fastest way to navigate the maze. Here's an example, using the initial centered points:

The spline curves are parameterized by a variable, which we'll call λ. This is defined such that each integer corresponds to one of the control points. This variable may not obey our acceleration limits, when going around a sharp turn for example. We can imagine a function λ(t), then use the chain rule to write a relationship between our spline curves, and the acceleration of the ball:


This is for the horizontal motion of the ball, and we can write a similar equation for the vertical motion. I struggled for a while with how best to derive the λ equation from these, and settled on the simpler solution of setting d^2λ/dt^2 = 0. This means λ increases linearly with time, at a constant rate given by
where a_max is the maximum acceleration applied by gravity.

Now we have a method to get the time associated with a given path – It remains to find a path with the shortest time. Each control point is an input, which means this problem has a high number of dimensions. We also need to keep each point inside its square, meaning this is a constrained problem. Both of these qualities make it difficult to optimize. I decided to use Scipy's dual annealing method, which gave good results. I may talk about annealing in a future post, since it's an interesting topic (which you may have more experience with than you expect).

In the animation below, I show the steps of the optimization. At each step, the algorithm adjusts the positions of the control points to minimize the total time, shown at the top.
Notice that as the optimization progresses, the path gets more straight lines, which allow the ball to accelerate without the speed limits imposed by tight curves. You can see this effect if we animate the ball's path in time:
We can check we're obeying the acceleration limits by plotting the value of the equation given above:


There appears to be some numeric error I couldn't get rid of that makes us cross the limits I set a little bit, but overall it looks like the best strategy involves whipping the knobs from one extreme to the other, suggesting this is another game where spastic movements are key!

Saturday, January 2, 2021

Out of My Element

Recently, a friend shared a meme about how COVID has made the idea of bowling particularly unappealing: Sticking your fingers into a ball handled by many people, which has also been rolling on the floor, then eating greasy food with those same fingers. After getting that image out of my head, I started thinking about the physics of bowling. In particular, I was interested in the curve that skilled bowlers are able to give to the ball:


Typically in physics, we make the assumption of "rolling without slipping," meaning that an object rotates at the correct speed for the contact between the two surfaces not to slide, i.e.

where v is the velocity along the floor and ω and r are the angular velocity and radius of the rotating object. If you're mathematically minded, you may notice this is the derivative of the relation between angle and arc length for circles. Bowling balls though have significant slip, as illustrated in this animation:

Wikipedia

When the player throws the ball, they give it some initial linear velocity and angular velocity, or spin. When the ball makes contact with the floor, friction begins pulling on the ball, which applies a torque. Since the ball is slipping, we need to know the relative velocity between the surface of the ball and the floor:
Note that the angular velocity is given according to the right-hand rule: If you point your thumb in the direction (ωxωy), your fingers curl in the direction of rotation. Using this, we can get the force and torque on the ball:

where μ is the coefficient of friction, m is the mass of the ball, g is the acceleration from gravity, and X is the cross product.

Sunday, May 10, 2020

Spare Brain

[Speaking of brains, I recently made an ebook version of Steve's cancer blog, available on Google and Apple! /shameless plug]

This week's post isn't exactly about Physics, but instead an interesting technique that can be used for data analysis, and I've used to make a card game. First some background: During my first semester at Swarthmore, I took a class on Jane Austen's novels. In one of the books, the characters played a card game called Piquet, which I had never heard of. I looked it up, and invited my friend Kevin to try playing it, which turned into a fierce tournament spanning many years. One summer, I developed an Apache Tomcat version of the game that could be played in your browser against various computer players, which I called WebPiquet. It's no longer functional, but all the code is here.

Skip ahead ~10 years, and I've become a fan of the blog AI Weirdness. It's written by a research scientist, Janelle Shane, who applies a program called a neural network to various tasks, and shows the results. You may have heard about neural nets in the news recently, thanks to GPT-2. The way they work is by imagining a set of neurons that are activated to different degrees by inputs. Those neurons are then combined to create a set of outputs.

As the name "neural network" suggests, the neurons are laid out in a network:
Moving from left to right, each neuron in one layer connects to the ones in the next. The connections between neurons specify different weights to tell how the first affects the next.

The key to getting a useful neural net is training. They're such a general tool that to get them to work for a specific job, you need a large amount of training data. By giving the network input data and tuning the weights according to the output data, we can try to find the best set of weights for a job.

The downside of neural nets is that without proper design and training, their results can be nonsense. Shane's blog features many of these, and there are Twitter accounts like @normalcatpics that feature particularly funny and/or nightmarish examples.

Getting back to cards, I thought it would be interesting to make a Piquet bot that took advantage of neural networks. I wrote an entirely new version in Python, which I naturally named Pyquet. I've only trained it for 10 or so hours, so some of the decisions it makes are still pretty bonkers, but the training was improving it slowly:
I alternated between making it play against itself, and a bot that simply made random choices. You can see above the score against the random bot is trending upward.

If you'd like to try it yourself, there are instructions and references at the link above. Feel free to post questions (or high scores!) below.

Sunday, January 5, 2020

Mathematics: The Shuffling

Recently, my brother-in-law Alex has been into the card game Magic: The Gathering. Over the holidays he had the whole family playing, and the question came up of how many times a deck needs to be shuffled to be "random". For an ordinary 52-card deck, the oft-quoted result of 7 was originally given in a New York Times article from 1990. Doing a bit more research, I found a paper following up on that article with a few more details. I wasn't entirely satisfied with that, both because the shuffles described didn't quite match my techniques, and because I found the probability calculations difficult to follow in my first jet-lagged, and now sickened state, so I wrote some code to simulate a series of shuffles. The two types of shuffle I usually do are:

Riffle: Split the deck in two, and interleave the piles, roughly alternating. I modeled this as a split using a Gaussian distribution around the center, and then picking from the two piles with 50/50 chance.

Overhand: Holding the deck in one hand, move packs of cards to the other. I modeled this as splitting the deck into a set number of unequal packs, and reversing the order of those packs.

Now we have to figure out the quality of these shuffles. I've talked about one way to measure randomness before, but that doesn't really apply here, since all the cards (in a standard deck anyway) are unique. For a deck labeled 1-52, the two quality measures I came up with are: the total number of cards in sequences, and the distance of each card from its original position. Over a series of shuffles, here are the means and standard deviations for those two measures on a set of 5000 decks:


For both distance measures, the riffle shuffle appears to reach a stable value in fewer shuffles. Breaking up runs is clearly not a strong suit of the overhand shuffle, but it moves cards from their original position pretty quickly. As far as the minimum number of shuffles though, it appears 7 is a reliable choice, but you could get away with fewer on average.

Sunday, November 3, 2019

Riding a Charger

In high school, I got interested in electronics tinkering through the blog Hack-a-Day. I haven't done much myself for many years, but I still read the blog, and last week there was a post that seemed ripe for physics analysis:

The setup is that each player has a button they can press and release. While the button is pushed, a capacitor is charged by a voltage source, and when it's released, the capacitor switches to power a motor that drives the horse. You can see the full plans here, but this is a simplified version of the circuit:
Made using www.circuit-diagram.org
In the state shown above, the voltage source (V) begins to charge the capacitor (C). At first, this would act like a short circuit, so we add a resistor (R) to limit the current flow. For this type of circuit, the charge on the capacitor is given by
The voltage over a capacitor is proportional to the charge stored in it, so as the capacitor charges up, it pushes back more and more on the voltage source, which slows the charge that's added. That leads to an asymptotic behavior:


When the button is released, the switch in the diagram above flips to the other side of the circuit, and the capacitor begins discharging through the motor. This acts like a resistor, but converts the charge flowing through it to motion, driving the horse. Once again, we have an asymptotic relationship, since as the charge flows out of the capacitor, it can't push as strongly:
Here, Q0 is the amount of charge we put on in the first step. This is similar to the plot above, but decaying to zero:


This made me curious if I could come up with the optimal strategy for getting the horse to the end as quickly as possible. That translates into the most charge in the least amount of time, or the maximum current. If we ignore the initial charge up, we can think of switching between some maximum and minimum charge:
The average current through the motor over one cycle is
where tC and tD are the charge and discharge times. The expressions for those are a bit ugly, so I won't write them out here. Rather than try to get the exact maximum current, we can try a variety of values for Qmin/max:
The best option appears to be keeping the capacitor at ~50% charge by rapidly flipping the switch between the two states. As with many games, the answer lies in hyperactivity!