Pages

Showing posts with label Cars. Show all posts

Sunday, January 26, 2025

Water Wedge

The streets around our house have many potholes, which fill up with ice:

Water expands when it freezes, which means when a hole fills with water that freezes, the ice can potentially make the hole bigger. To do this, the ice puts pressure on the asphalt, and vice versa. Adding pressure can make it more difficult for ice to freeze, so I looked up some info on asphalt strength. This paper gave a plot comparing the bond strength for different aging times:

Figure 8

These are all around 2-4 MPa. We can look at the phase diagram for water to see how this would affect freezing:

Wikipedia

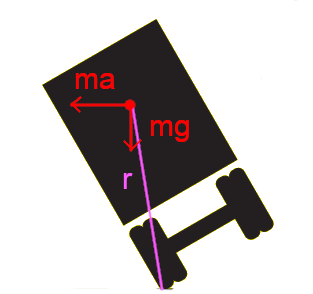
This is well within the range where the freezing point is still around 0°C, so we don't need to worry about the pressure we're applying. Water expands by about 9% when it freezes, so we can imagine water filling a crack, then pushing out in all directions:

That's the general idea I had in mind, but getting into the details, the steps I used are

  1. Begin with a flat road. Put a dent in the center with depth y0 (*parameter).
  2. Find all points below the road, and use them to define a polygon.
  3. Find the centroid (center of mass) of the polygon and push all points out by 9%.
  4. Push the polygon down according to its weight (*parameter).
  5. Add points anywhere the separation has passed a threshold.
  6. Adjust points along line for equal spacing.
  7. Repeat from 2.

I added steps 5 and 6 since otherwise the crack just scaled up from the initial dent. We can look at the type of crack these steps give as we cycle through freezes/melts:

This seems a little extreme, but we can take a look at how this changes with the two parameters I marked above. The two qualities I was mainly interested in were the width and depth of the crack. We can see how those change in time with different y0 and weight values:

It makes sense these curves look exponential, since the increase depends on the current size. What really surprised me though was how well-separated these two qualities are according to the input weight and y0. These plots suggest that the width is almost wholly determined by the weight, and the depth by the initial depth. For the depth, this can easily be tied to the exponential behavior – Starting deeper increases the rate the depth increases. A little less obvious is the weight, but if we look at the initial diagram of the setup, the wedge shape of the ice means pushing down also pushes out. A quality of exponential systems is that they can very quickly get away from their starting point if left unchecked – A reminder to keep those roads smooth!

Sunday, January 19, 2025

Beet the Traffic

We watch the local news every morning, and this week a story caught my interest: Alternatives to using road salt to avoid harmful risks. The key point of the story is that runoff from salting the roads can damage the surrounding environment, but adding beet juice to the solution can make it stick to the roads better. Reading up on the idea, I've found it's still debated whether this idea is really better for the environment, but the bit I was curious about is the ability to stay on the road.

Looking into ways I could model this, I found a paper discussing how droplets spread over time based on their surface tension. Their model was a bit more involved than I wanted to get, so I made some simplifications: The droplet takes the form of an ellipsoid with constant volume and circular base. This constrains the relationship between the height and the radius. The paper defines a value they call h* where gravity and surface tension balance. After my simplifications, it takes the form

where ρ is the density of the fluid, g is the acceleration due to gravity, and γ is the surface tension. For a given fluid, we can look up the surface tension and density. I decided to try a salt-water solution (γ, ρ), a sugar-water solution (γ, ρ), and molasses (γ, ρ).

The paper gives a t^1/5 form for the height of the drop, so we can start each of these fluids as a hemisphere and see how they spread as they approach their respective h* values:

This shows the sugar and salt spreading at roughly the same rate, contrary to the idea given in the report, so I expect my model is not capturing all their qualities. What I find really interesting though is that the thicker molasses actually spreads faster, because it's more dense that the other two, so gravity exerts a stronger force. Naturally, this brought to mind a bit of history from my home state, when a flood of molasses from a ruptured tank cut a swath of destruction through Boston!

Sunday, May 12, 2024

Whistle While You Wheel

Shortly after Marika and I got our car, we installed a roof rack to carry our cargo box for camping trips. The first time we drove on the highway with it, we suddenly heard a clear, crisp note from above our heads. As our speed changed, the note would suddenly shift to a new pitch, just as clear. The roof rack has a channel running down the center of its length, with a rubber seal on top that opens on each end. I realized it was acting exactly like a flute – Air blown across one end of an open tube was resonating at a specific frequency. I had hoped to make a simulation of this at the time, but I couldn't get my head around the equations involved.

Some time later, I found this wonderful interactive simulator, and tried adapting that to this situation, but now the obstacle was introducing the pipe geometry. Finally this week I looked again, and was saved by Daniel Schroeder, who introduced me to the HTML5 simulations I've shown here. Schroeder's demo shows how a steady stream past a barrier can create vortices, but we want a tube with an opening on top. Here's the boundary I came up with:

Now we can see what happens to air moving left to right. The simulation used here keeps track of the density and velocity of air at each point. To get the next state, it uses the Lattice Boltzmann method, which involves two steps: collision and streaming. The collision step changes the velocity in each cell to push the system toward equilibrium, and the streaming step uses those velocities to shift the density between cells. You can find my adaptation of Schroeder's code here. I found that this setup would pretty quickly reach equilibrium, but to get sound we need oscillation. Adding a little bit of noise allowed it to settle into an oscillating pattern. Looking at the full map we can only really see the transients (though those are pretty nifty):

If we instead focus in on the opening of the tube, we can see the density oscillating around a central value, which is exactly what we need to get sound:

Now on to the pitch question: We can measure the relative strengths of the frequencies using an amplitude spectral density, and see how it changes for different speeds.

Sharp peaks indicate a clear note, and we can see a few here, separated by the different speeds. This is exactly what we experience in the car, and it's pretty cool to see it show up in such a pared down model – One of the things I love about physics!

Saturday, March 2, 2024

Circumferential Evidence

Shortly before starting our move to Florida last year, we took our car to have all 4 tires replaced for the 1000 mile trip. On our way back from the dealer, the car's tire pressure monitoring system went off, warning that one or more tires were not properly filled. We checked each one after we got home and all were fine – Consulting the manual told us the system often gives false positives after tire replacements, and needed to be reset. Clearly the system was not directly measuring the pressure, so I was curious how these work. I found a nice explanation from Bridgestone Tire: The system measures the revolution speed of the tire and compares to the speed over the road, in effect measuring the tires' circumference. What I wanted to know is, what sort of conversion is needed to get from circumference to pressure?

The effect of lower pressure will be for the tires to ride lower to the ground, flattening against the road. Here's how I imagined it:

Here the tire has inner radius r, outer radius R, and the axel is a height h above the road. Initially, I tried to figure out the pressure directly: Each tire is applying a force to hold the car up, and force is equal to pressure times the area of the contact patch. That was a bit of a mess, but I realized to detect an under inflated tire, we can instead look at the volume of air inside, which is related to the pressure through the ideal gas law. That turns this into a geometry problem: We want to find the perimeter and area of a circle with a wedge replaced by a triangle. Skipping some intermediate steps, the perimeter is

and the area is

To get the volume, we can just multiply by the width, w, of the tire. To put some numbers to this though, we have to enter the arcane realm of tire sizing.

Our car uses tires of size P235/55R19. The first number tells us the width in millimeters. The number after the slash is the "aspect ratio", which is a percentage given by (R-r)/w. Things get even weirder from there, since the third number is the wheel diameter, equal to 2r, in inches! We can combine these measurements (after converting to a single system of units) to get r, R, and w, then plug those in along with a couple values for h. We can then look at how the tire circumference changes with volume of air lost from the tire:

This plot covers the range from fully inflated to riding on the rims, so I was surprised it stayed so linear. While thinking about this, I remembered an episode of Mythbusters where they looked at improved gas mileage from over-inflated tires – Here's a similar analysis from Popular Mechanics. That article attributes the effect to lower rolling resistance, but my results make me wonder if part of it is getting increased circumference, resulting in the same number of revolutions taking you a greater distance: For the two ends of the plot above, each mile could require 693 to 718 revolutions.

Saturday, February 24, 2024

A* is Born

I've mentioned before that I never learned to drive, but recently Marika and I have been discussing finally getting my license. I've always found the mechanics of parallel parking perplexing, and I wondered if I could make it clearer to myself with a simulation. Initially, I tried to work out a full kinematic model: Each tire is applying a force and torque on the car's center of mass, causing the car to move and turn. I couldn't get that to work properly though, instead ending up with the car skidding sideways crazily. I realized instead I could ensure the wheels stayed in line by looking at the perspective of the rear axel. During a turn, these wheels stay pointing straight, but can spin at different rates. We can therefore represent the motion of the car as a combination of forward (or back) and rotating around the back tires. I implemented this in Python, then as a test had it drive forward steering 45° to the left:

So now we have a representation of our car, but how can we get it to parallel park? I tried a couple series of commands based on my second-hand parking experience, but I still couldn't get the car to do what I wanted. Then I started thinking about the recent developments in self-driving technology, and decided to try finding the solution algorithmically. After reading a bit about different path-finding techniques, I chose A*, which tries to find a path that gets closest to the target, using the fewest steps. Wikipedia has a nice animation of an example search:

Wikipedia

The technique works by keeping a list of open points (blue), which can spawn new open points by trying all possible moves from a given point. Once all the new moves are generated, we move that point to the closed list (red). We keep the list of open points sorted according to how many steps we are from the start and an estimate of the distance to the target. That way, we can generate our new points from the best point so far – You can see that effect above when the search gets around the wall.

To limit the number of choices to feed into this technique, I chose to give steering options of 0°, 45° left, and 45° right, while driving forward or backward a fixed amount. Given that I didn't spend much time optimizing my code, I was surprised at how quickly it was able to get close to the target. The animation below shows the current best point in blue at each step of the search, with the target in red:

Looking at the distance each of those "best points" lands from the target shows the advantage of the A* search:

A* allows the car to get further from its goal temporarily, resulting in a better final position. This all looks very promising, so let's see that robo-chauffeur in action!

I'm getting some "nervous student-driver" vibes from this, but overall not bad. I think I may be better off with my mushy brain for now, but it's only a matter of time.

Sunday, January 14, 2024

Fraught Freight

Now that I'm actually going into an office every day, I'm once again a car commuter, and I'm filled with transportation-related questions! Our route mostly involves the highway, and I was curious about the rollover signs on off-ramps:

rxrsignals.com

This shows a truck tilting at a 30° angle, while going 25 mph. The tilt comes from the fact that the truck is going around a curve, which requires applying a centripetal force. Since this force is applied to the tires, there's a torque produced, which will act to tip the truck toward the outside of the curve:

The red dot marks the truck's center of mass, with m the total mass of the truck, and a the acceleration required to make the turn. This is given by

where R is the radius of the turn. To find this, we can use Google Maps' measuring tool on the ramp by our home:

Given this R, along with the speed and dimensions of the truck, we can find the height of the center of mass that would produce the given tilt – The diagram above is too high, and the truck would tip over, but to balance g and a, we would need

where θ is the tilt angle. Using our 30° case, and the turn shown above, we can check the heights for several different speeds:

In most cases, we should expect the truck to be loaded such that the center of mass is in the center of the truck, which means the posted limit for our turn of 25 mph is just about right!

Sunday, November 26, 2023

Stopping Traffic

Since coming back to Florida and commuting every day, we've noticed that the traffic lights stay on a particular direction for a long time before switching. This is especially annoying as a pedestrian (who dislikes jaywalking), since it means the walk from the parking lot to my office can vary a lot depending on what lights I hit. I was curious whether I could design a simulation to test the effect of the light duration on the time cars spend waiting.

The setup is a 4-way intersection with lights that swap red/green with separate green durations for North/South and East/West. Each road has a rate cars arrive, and each car randomly chooses to go left, right, or straight. As cars pass through the intersection, we can keep track of how long they had to wait since arriving. Below is an example simulation – The arrows are the lead cars on each road, pointing in their planned direction and colored to indicate how long they've been waiting.

We've got a lot of variables going on here, so it took me a while to figure out how to assess the results. It would take too long to try every combination, so I just sampled from a reasonable-sounding range. I considered using a corner plot to see the effects of the inputs, but the sampling was too sparse to see a trend. One way to reduce the number of parameters is to consider where each car is coming from, and use the traffic rate and light duration from that side. Then I thought about the units: the traffic rate measures cars/time, and the light duration is a time, so multiplying them gives an average number of cars during a green light. Plotting this with the waiting time shows a clear trend:

I separated out the different turning directions, expecting that left turns would need to wait longer, but that doesn't seem to be the case. This shows that to minimize the waiting time, we need to keep the rate*duration small, i.e. for busy roads the lights should change rapidly, which is not what I expected.

This also implies that the Florida lights are expecting a low rate of traffic – Not our experience the past few weeks coming home during rush hour and hitting gridlock! Of course, this model may be inaccurate, and I should stick to gravitational waves, rather than civil engineering.

Saturday, May 27, 2023

Adversarial Ambulation

When crossing the street, I typically work on the assumption that drivers at minimum are unaware of me, and possibly seeking to hit me. I've often wondered whether crossing perpendicular to the road is the best strategy, or whether angling my path away from an oncoming car would be better. If we imagine crossing a road of width w, while a car approaches starting y0 up the road, we can write the distance squared (to avoid taking a square root) as

where t is the time since entering the road, the vs are the respective velocities of the pedestrian and the car, and θ is the angle from perpendicular for the path. We want to find the angle that gives us the greatest distance (or distance squared) when the car is at its closest point in time. To find that, first we find the time of the closest approach:

Now, we could plug this into the first equation, and try to maximize over θ, but things are already getting ugly, so instead, let's plug in some values and plot it. For a 20 ft wide road, with a car starting 100 ft away and driving at 30 mph, we can plot the closest approach for different angles and walking speeds:

At high enough speeds, it is worthwhile to angle yourself away from the car, but unless you want to book it, straight across is probably best. You may notice the slowest speed in blue puts you farther than the next highest in orange – This is because it's so slow, the car passes before you get significantly into the road. Definitely avoid that orange speed though – That kink at around 38° is a distance of 0 ft, otherwise known as being run over!

Saturday, October 1, 2022

A Charge of Battery

This week, I have a question from my mother Sally about their Chevy BoltI was thinking about the most efficient way to drive the Bolt on a long trip: Do you drive more slowly, so that your miles/kWh are more and you don’t need to charge as much? When you do charge do you stop frequently and only charge at the highest rate (the rate declines as the battery % is higher, e.g. 42kWh, declining to 26kWh), or do you stop as little as possible and stay until you’re at 80%?

As Sally outlines, there are two states the car will be in during a trip: charging and driving. The amount of time it takes to add a certain amount of charge to the battery depends on how much charge is in it – As it fills up, it gets harder to add more. During charging then, we can write


that is, the rate of charging is proportional to the space remaining. While driving, we have to push against a wind resistance that depends on our speed:


Drag typically depends on the square of velocity, meaning that increasing speed can quickly become counter-productive.

Now, both these equations I've written are just proportionalities, which need specific scales and shapes. Normally I'd have to make up something based on wild assumptions of a clueless physicist, but lucky for me, Bolt drivers are my kind of crazy, and have measured the behavior of their cars in detail!

For the first equation, I found this chart from InsideEVs:

and for the second, I found one from ChevyBolt.org:


Since these are just graphs, I had to do a bit of fitting, but I'm pretty happy with the results. To answer Sally's question, I chose a bunch of different driving speeds and max/min charge levels. We drive the car at the given speed until the battery hits the minimum charge level, then we stop and charge until it gets to the maximum charge. We continue for 1000 miles, then check the average speed during the trip, and the number of stops.

First, I plotted a heatmap of the average speeds for the different max/min charge values, planning to mark the point where we get the best speed and the fewest stops. Unfortunately, it turned out both of those always occurred with a min charge of zero, so it's easier to see them as lines:

I found this a bit difficult to take in, so I tried plotting only the zero min charge case for each speed:

This shows some really interesting results: Because of the difficulty in getting up to the battery's capacity, high max charge can result in spending most of your time charging, even at high speeds. However, if your max charge is too low, you have to stop over and over, even if it's only for short time.

Thanks for a great question, Sally!

Sunday, July 17, 2022

Self-Jamming Cars

This week I wanted to try another Complex Systems-style simulation, this time based on something I had originally seen on Mythbusters, but others have tried with similar results: Traffic jams that appear out of nowhere simply due to drivers varying their speed. The system is fairly simple: Some number of cars drive on a circular track, trying to go as fast as possible while maintaining a safe stopping distance and obeying the speed limit. However, they may not all accelerate at the same speed, and can brake unexpectedly. These error factors result in some interesting effects, including waves of slow speed that travel backwards around the track.

To simplify things, I assumed the cars were either accelerating at maximum, or braking at maximum. They would decide based on the stopping distance from the car ahead of them:

where v is the car's velocity, and a_b is the braking acceleration. If the distance to the next car is less than this, we brake, otherwise we continue accelerating.

The controls you'll find below are the number of cars on the track, the maximum speed they'll go, the rate of acceleration, the rate of braking, the size of the variation in acceleration rate, and the rate at which that variation changes. This last factor is needed because if we change the acceleration error at every step, it tends to average out and have little effect. There's also a brake button that makes the red car slow while holding it down. As with many of these Complex Systems topics, I'm always surprised by the dynamics that emerge with just a few simple rules. Be sure to post a comment if you find something particularly weird!

Sunday, February 20, 2022

Snow Fugitive

A couple weeks ago I got a really interesting question/story from my friend Garrett, relating an experience entirely foreign to me here in Florida:
Last weekend we got a huge blizzard in MA. In Boston we tied the record for the most snowfall in a single 24h period (~24''). I have street parking and my car gets absolutely buried. Snow up to the windows on both sides. The next day I dig out and am driving my car. Everything is fine until I get on the highway. Once I am above ~50mph, my car starts to shake violently. I pull over, thinking I may have a flat tire. Nope. The tires are fine and no snow is in the wheel wells. So I drive again and it is still happening. So I come up with the following hypothesis: When my car was parked and getting snowed in, the snow built up more-so on the lower side of my wheels/rims. This gave my wheels an uneven moment of inertia. Below a certain speed the force and oscillation period of the unbalanced wheels was low. But above ~50mph my suspension could no longer compensate, and I began to feel the vibration (similar to an unbalanced washing machine).

My initial thought was that at a certain speed he was hitting the resonant frequency of the snow/wheel combination. As the wheel turns, it has to exert a centripetal force on the snow to keep it moving with the wheel. According to Newton, that means the snow is exerting a centrifugal force on the wheel, which will be given by

where m_s is the mass of the snow, v is the car's speed, R is the radius of the tire, and r is the direction from the wheel hub to the snow. This will be a sinusoidal force, with frequency proportional to the speed of the car. That appears to be consistent with Garrett's experience, where the vibration didn't start until he got to a certain speed.

To check that, we need to come up with a model of the car's suspension. I found this paper promising: It suggests a setup where the tire and the car suspension each act as a damped spring.

The ks are the spring constants, the cs are the damping coefficients, and the zs are the height from the road. We can write the forces on the wheel and body as
Each of these springs will exhibit resonance at a frequency we can calculate:
However, if we plug in some of the values used in the paper above, we get frequencies that correspond to about 1 mph or less! Garrett pointed out that I shouldn't be so surprised:
I think it makes sense that the resonance peak you identified is at such a low speed. I'm assuming that car manufacturers design the suspension to NOT resonate (due to unbalanced wheels) at typical driving speeds. Moreover, what I experienced did not feel like a resonance peak. I did not notice the vibration at all until I was above ~40mph or so, but from then on the vibrations increased with increasing speed. There was no point at which I felt the vibrations decrease as I increased speed. 
Taking another look at the equation for the snow's centrifugal force, we see it's proportional to v^2, so the faster the car is moving, the more the snow unbalances the wheel.

I put together a simulation of the system (using SSMs again, since I've been spending too much time around engineers) and we can see exactly this effect in both the average displacement of the car body:
and in the maximum displacement:
I had such a great time thinking about this and discussing with Garrett, I decided to put together another HTML5 doodad that you can play with below. I had to tweak the parameters a little, and there are still some significant transient effects, so you may get some crazy results just after changing the inputs, but they'll settle down after a few seconds. Thanks for the idea, Garrett!

Saturday, July 18, 2020

Vroom!

This morning for breakfast, we got some pastries from a favorite bakery. On the way home, another car honked its horn as it passed, and the changing pitch reminded be of something I've often wanted to try: I wondered whether I could simulate the sound of a vehicle moving by an observer, by calculating the Doppler shift at each point.

The Doppler shifted frequency is given by
where v is the velocity of the vehicle, c the speed of sound, and f0 the original frequency. The dot product with r means we only take the part of the velocity that is along the line-of-sight between the vehicle and the observer. That dot product is what leads to the changing pitch: As the vehicle approaches the observer, the angle decreases, lowering the pitch.

Sunday, May 24, 2020

Roader Coaster

There's a road near us with a bump, and almost every time we go over it, I get the feeling of my stomach dropping, just like a roller coaster. As with most things that I dislike (as well as things I enjoy, or I'm curious about) I wondered if I could model what's going on!

My assumption was that in going over the bump, the car was accelerating at some significant fraction of gravity. Given the car's velocity and the shape of the bump, I should be able to find the acceleration. The first thing I thought of was centripetal acceleration:
This is the acceleration required to move in a circle, where v is the velocity, and r is the radius of the circle. We have a curve, not a circle though, so how can we get a radius? There's an idea called an osculating circle, which touches a point on a curve and has a radius that allows it to match the curve (at least on an infinitesimal scale) at that point. Before we can calculate that though, we need to define our bump.

I figured a Gaussian curve would make a nice smooth bump. Unfortunately, combining that equation with the osculating circle makes for a huge mess, so I figured I'd let Python deal with it:
The point moves at a constant velocity along the curve – This is a bit more complicated than it sounds. We need to take into account both the x- and y-movement:
Since we're already doing things numerically, we can choose our points to be evenly spaced along the curve, rather than the more typical spacing along x.

After making that fancy animation though, I realized it's not the centripetal acceleration we're interested in, but only the y-direction, since that is what will cancel gravity. Calibrating the bump to 75 cm high, and the car surface speed to 30 mph gives the y-acceleration as
The maximum is just over 0.5% of gravity, so I'm underestimating either the size of the bump, or the sensitivity of my gut!