Pages

Showing posts with label Light. Show all posts

Sunday, January 5, 2025

Make Like a Tree and Get Out of Here

Swarthmore's Scott Arboretum traditionally gives incoming students a plant to care for in their dorms. Shockingly, the Hawaiian Schefflera I received in 2007 is still going 17 years later! Over the years as I've moved from place to place and kept the plant in different environments, I've been impressed by its ability to track the sunlight, frequently growing lopsided as it reaches toward the nearest window until I think to turn it. This has resulted in some twisting, gnarled branches:

If you've been reading this blog, you can probably guess where this is going – I was curious if I could make a simulation of my plant's heliotropic tendencies. I decided to model the plant as a collection of connected branch segments, each a fixed length and pointing at an angle relative to the vertical. At each step, we iterate over all the segments and pick an action:

  • If the segment has no children, i.e. it's at the tip of a branch, we add a new segment on the end with a probability p_grow/size, where size is the number of existing segments.
  • If the segment does have children, we add a new one with probability p_sprout/size.
  • If neither of those occur, we adjust the angle of the branch to point closer to the sun's current position. The adjustment is proportional to how far off the angle is, how many branches are on the end of this one, and a constant stiffness for the plant.

I tried a bunch of values for the different parameters until I landed on a range that gave plants looking reasonably similar to the real thing (click to enlarge):

The numbers along the top give the stiffnesses, and the ones on the left give the sprout probability. The sun moves back and forth sinusoidally, which you can see in the snaking of the plants. I wasn't able to get my digital plants to spread as much as the analog one, possibly because I'm not accounting for the plant casting shadow on itself, but I'm still pleased with the results – The top center one seems particularly good. If you'd like to try for yourself, the code is here.

Saturday, October 26, 2024

A Mass of Incandescent Gas

[Title from They Might Be Giants.]

This week, I got a question from my father Steve: We're able to identify the source of nuclear materials used in reactors and weapons from their isotope ratios. Could we do the same thing to figure out which star material that hits Earth came from?

First, let's talk about isotopes: Atoms are made up of a nucleus or protons and neutrons, surrounded by a cloud of electrons. The number of protons tells you what element the atom is – one for hydrogen, two for helium, and on down the periodic table. The number of electrons tells you the charge of the atom – neutral if it's equal to the number of protons, negative or positive for more or fewer electrons. Finally, the number of neutrons tells you the isotope – These are variations on the same element. For example, most carbon on Earth is called carbon-12, which has 6 protons and 6 neutrons for a total atomic mass of 12. However, some is carbon-14, which has 6 protons (since it's still carbon), but 8 neutrons. This configuration is unstable, and gradually decays to carbon-12. The mixture of carbon-14 and carbon-12 leads to radiocarbon dating, which is used in archeology to measure the age of excavations.

Natural uranium is almost all U-238, with small amounts of U-235 and a few other isotopes. Putting it in a nuclear reactor though will change those ratios. As the U-238 decays, it loses neutrons, raising the amount of U-235 present. The amount of U-235 in a sample can be further increased through enrichment, which uses various methods (often advanced centrifuges, which come up in nuclear policy) to separate the lighter U-235 from the heavier U-238. There can also be other isotopes of other elements mixed in depending on the exact process a reactor was using.

Now to stellar compositions: Stars are mostly made up of hydrogen, but the star's mass causes the hydrogen to fuse into helium, releasing energy that helps keep the star from collapsing. Helium can fuse too, and that can continue a few steps down the periodic table, but it's limited, typically petering out near iron:

Wikipedia (Click to enlarge)

The elements in yellow may be present in an active star, and will be spread around the universe when the star eventually explodes. We can find which are in a given star by looking at their absorption spectra:

Wikipedia

The star emits light in a black-body spectrum due to its heat, but the elements it contains will absorb some of that light, leading to dark bands on the spectrum. The frequencies (colors) of those bands correspond to different elements that let us determine the composition of the star.

Now to Steve's suggestion: When massive particles hit the Earth, could we use their makeup to associate them with a particular star? To my understanding, the answer is no, the particles that hit us are typically single protons or neutrons, not entire atoms, and certainly not the collection of atoms that would be needed to find a concentration of certain isotopes. There's another problem too: Uranium and other elements typically associated with isotopic signatures aren't present in active stars – If you look at the table above, you see those need neutron star collisions to form.

So it seems this idea won't work for distant stars, but if we screw things up badly enough on Earth, future scientists will be able to figure out where things went wrong, and curse that we ever trusted Mr. Clevver.

Saturday, September 21, 2024

Looking Radiant

In France we had the fancy induction cooktop, and the camper had gas burners, but now we're back in Michigan with the good old resistive coils I've used most of my life. One thing that's always struck me about these stoves is that then when turned on high, the coils glow red. This is due to black-body radiation, which is the spectrum of light emitted by objects depending on their temperature. For an ideal black-body, the color and brightness will be entirely dependent on the temperature. I wondered whether I could use this to find the temperature the stove heats to:

The Wikipedia page for black-body radiation has a nice chart of the overall color for different temperatures:

Wikipedia

We can get the RGB values of those colors and compare to those from the stove picture:

The solid lines represent the values from the chart, while the dotted lines are samples I took from the image. The red and green aren't bad, but you can see my samples have way too much blue for a true black-body. Ideally, a black-body shouldn't reflect any light, absorbing it all instead. This brought to mind Vantablack, but I'm not sure how that would stand up to high temperatures, and it seems like a dangerous world to get into.

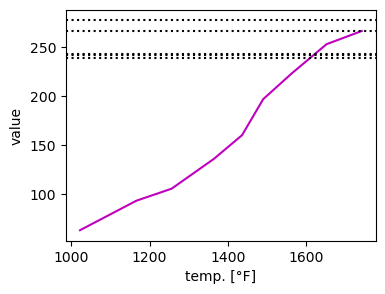
To resolve the discrepancy in color distribution, let's try looking at the overall brightness by taking the root sum squared for the above:

For 3 out of the 5 samples, we get a crossing at around 1600°F. I couldn't find a definitive source for maximum stovetop temperatures, but I found a Reddit post that suggests the range 1470°F to 1652°F, agreeing nicely with my measurements!

The neat thing about black-body radiation is how universal it is: When a welder heats metal to the same brightness as the Sun, it's because they're the same temperature, and the whole universe is still glowing from the heat of the Big Bang!

Saturday, June 22, 2024

Ozoning Regulations

Recently our local news in Michigan issued an air quality alert, which mentioned an increase in ozone levels. I was curious about this, since I know the ozone layer protects us from harmful UV light, and the hole over the South Pole is a major environmental concern. That hole was caused by certain pollutants, so I was surprised to hear increased ozone also being associated with poor air quality.

The key is where the ozone is in the layers of the atmosphere. The ozone layer that protects us is in the Stratosphere, while the one associated with poor air quality is in the Troposphere:

Wikipedia

The majority lies above 15-20 km and absorbs 97-99% of the UV light that comes from the Sun. The ground-level ozone results from byproducts of burning fossil fuels. Since ozone is made of 3 oxygen atoms, rather than the 2 that make up oxygen's breathable form, it's heavier, and so I wondered about the process that keeps it at those high altitudes. It turns out it's a continuous cycle, in which oxygen atoms bond and unbond in different configurations. The process is mediated by UV light, which is absorbed by ozone to break it into gaseous oxygen. Since it's absorbed up there, it doesn't make it to the troposphere to break up the ozone down here (or damage our DNA, so overall plus).

The benefits of ozone in the upper atmosphere, combined with its dangers in the lower atmosphere made me wonder if there were a way to transport it upward. Other people have wondered that, and unfortunately it doesn't work. Since ozone is heavier than oxygen, it won't naturally rise, and we'd need to carry it upward. That has its own problems though, since ozone corrodes many materials, so it would get expensive to keep making new containers. The other problem is that there just isn't a lot of ozone down here compared to what the upper atmosphere holds. It would be difficult to collect enough to make the process worthwhile. It seems our best bet is to stop making ground-level ozone in the first place, and to keep the upper-level ozone doing its job!

Sunday, May 5, 2024

Making a Spectacle

This week I noticed something interesting about my shadow: I could see the lenses of my glasses casting a dark spot with the rest of my head. This made me curious, since I can see through my glasses, meaning light is passing through them, so why would they cast a shadow? Taking them off revealed an even more interesting effect:

There's a dark spot in the center, but a magnified brighter area around it. I decided to try some ray-tracing, a technique in optics where we consider beams of light coming from a source and follow their path through a system. Often this is done using matrix optics, in which lenses and other elements are represented by matrices which are multiplied together to create a system. Rather than deal with that directly though, we can use Python's RayTracing package to handle the math for us.

Lenses are typically defined by their focal length, which specifies the distance from the lens where parallel beams passing through it converge. However, glasses prescriptions are given in diopters, which are the inverse of the focal length. I'm nearsighted, which requires a lens around -5 diopters. The negative means that the convergence point is on the same side of the lens as the source. This is a little clearer with a diagram: Since the Sun is far away, its light is roughly parallel, so we can look at what my lenses do to a bunch of parallel beams (click to enlarge):

This shows the light being spread out by the lens – If you follow those lines to the left, they converge on the opposite side of the lens, corresponding to the negative focal length.

That accounts for the magnified bright spot we saw above, but it's only considering the light that goes into the lens – There's also light that goes past the lens on the sides. We can add together this light with what was redirected by the lens to get the total image:

The different lines show distances from the lens to the surface of the shadow. As in the picture that started this, we see a dark spot surrounded by a brighter area! What's interesting is that, because the beams from the Sun are parallel, the shadow (drop in intensity) stays the same size for all the distances, but the brighter area gets bigger or smaller. I've been wearing glasses since the 4th grade, but somehow this is the first I've wondered about their shadow – One of those blind spots that seems obvious once you see it.

Saturday, July 29, 2023

Birefringe Benefits

This week, I set a plastic container on our kitchen counter in the sun, and noticed an interesting effect:

The reflection of the sunlight off the counter gave a rainbow pattern. I recalled seeing a similar effect in demonstrations of polarized light. The stresses frozen into plastic cause a change in the light's polarization, which you can observe by putting it between two polarizing filters:

Wikipedia

I've mentioned polarizing filters before, in the context of reflection, but as I thought about this situation more, a problem occurred to me: The plastic is birefringent, which means it rotates the polarization of light passing through it, but the light from the sun is unpolarized, so rotating it should have no effect. The light only gets polarized afterward when it reflects off the countertop. To understand why, I have to get into the weeds a bit, so I suggest reading that earlier post I linked to before continuing.

Sunday, May 21, 2023

Stained Steel

This week I was taking a frying pan out of our dish rack, and it caught the sun, showing a surprising array of colors:

I wondered where these might be coming from, so I started reading about the makeup of stainless steel. I knew it was an alloy of iron and another metal – I thought maybe aluminum or tin, but it turns out it's chromium. The chromium reacts with oxygen from the air to form chromium (III) oxide, which protects the iron from forming iron oxide, or rust. If this layer gets damaged, a new one quickly forms. Heat makes the reactions involved happen more easily, so I wondered whether the color differences were due to greater heat in the center of the pan creating a buildup of the chromium.

I was able to find a paper analyzing the compositions that lead to different colors:

Figure 8

Using macOS's color meter, I was able to read the RGB values of the samples given. I plotted those to see if there were any obvious trends:

The blue seemed relatively linear, so I decided to use that as a link between my photo of the pan, and the composition data. I took the average of concentric circles outward from the center of the pan:

There does appear to be a downward trend in the chromium and oxygen fractions, which would be consistent with the heating idea, but there's an awful lot of noise, and the upturn at the edge. Part of the problem may be that lighting can have a big effect on color perception (I'm reminded of the dress from several years ago). The colors on our pan don't seem to match well to the scale used in the paper. In any case though, it was interesting to learn more about stainless steel, and know the colors are a sign it's working, not degrading!

Sunday, April 2, 2023

Ring Around the 'Rora

Recently I started reading a page called Michigan Aurora Chasers, which shares pictures of the aurora taken in our current home state. The pictures are incredible, but I was really interested by a post that came up discussing Newton's Rings, an effect that can sometimes appear when viewing light from a monochromatic source through a series of lenses, like a camera.

Wikipedia has an example of the effect in a microscope, viewing a sodium lamp:

Wikipedia

For aurora viewers, this happens due to using a flat filter over their curved camera lens. When the light passes through the filter, some will bounce between the lens and filter one or more times, changing the phase. This light can then interfere with the light that passed straight through, producing the dark fringes seen above. The extra distance traveled by the light changes depending on how far from the center of the lens it hits:


The wavelength of light also changes how these rings will appear, since the total phase change from bouncing once from each surface is φ = 4πd/λ, where d is the distance between the filter and lens, and λ is the wavelength. We can scan through the visible wavelengths to see how the pattern of fringes changes (thanks to John D. Cook for the wavelength/RGB conversion):
Due to the spherical shape of the lens, as we get farther from the center, the distance changes more rapidly. This means that if we add up several wavelengths (since true monochromatic light is rare in nature), we see that the rings are only visible near the center of the image, as in the aurora photos from the link at the top:

Our area of Michigan is a bit too far south to get to see the aurora in our own sky, so it's been great to get to see the amazing pictures the group members post. On top of that, they introduced me to this really neat optical effect – Thanks Michigan Aurora Chasers!

Sunday, January 30, 2022

Pigment of the Imagination

I've previously mentioned Janelle Shane's blog, AI Weirdness, about applying artificial intelligence software to unusual tasks, often producing hilarious results. This week's post was about coming with new paint colors, and after I shared it on social media, my friend Garrett brought up an interesting aspect: Computers typically express color using a standard called sRGB, but this is only a subset of the colors our eyes can perceive. Thinking about this sent me down a rabbit hole of reading about color perception, generation, and physical properties.

As a physicist, I think of color as synonymous with wavelength, a property of light. Visible light is a small slice of the EM spectrum, ranging from longer-wavelength red to shorter-wavelength blue:

Cropped from Wikipedia

However, this does not capture the full range of colors people see! Humans perceive color via cells in our eyes called cones. They come in three varieties, which are sensitive to different parts of the visual spectrum. I long believed these were evenly spaced in red, green, and blue, but it's not as clear-cut as that. While reading about this stuff, I found a Python package called Colour, which includes a tool to plot the different cone's responses to wavelengths:

As you can see, there's pretty significant overlap between the nominal red and green cones, and the red also can pick up blue light. People with color blindness are typically missing one type of cone, and you can see that that wouldn't decrease the range of wavelengths, just the nuance. [Correction from Garrett: This is actually the "standard colorimetric observer," which is different from the actual cone sensitivity, which doesn't include the bump in red.]

In 1931, a group called the International Commission on Illumination (CIE, since they were French) came up with a description of the space of colors humans perceive, using the responses of the 3 cone types shown above. We can transform those 3 variables to eliminate the overall intensity, and just look at the color variation in what's called a chromaticity diagram:

Around the curved border you can see labels for the wavelengths of those pure colors, but the interior colors can only be produced by mixtures. The lower edge is called the line of purples, and represents colors that have no single-wavelength equivalent.

Of course, everything I've showing you is being displayed on your computer screen. An LCD screen displays colors by mixing amounts of red, green, and blue light:

Woods et al., Figure 3

Once again we see that these colors have a fair amount of overlap, but they are more separated in wavelength than our cones. To specify the amount of each color to use, computers use one byte (up to 256 values) for each of red, blue, and green. That range of values results in the dashed triangle in the chromaticity plot above. As Garrett pointed out, this is only one corner of that space. The trouble is, We're looking at that plot on a computer using RGB color, so we can't even see what we're missing! The funny thing is, when I originally shared Shane's post, I was thinking of my artist-cousin Autumn using some of the new AI-named colors, but working in the real world her palette is even more expansive.

Saturday, January 23, 2021

Searching in Vein

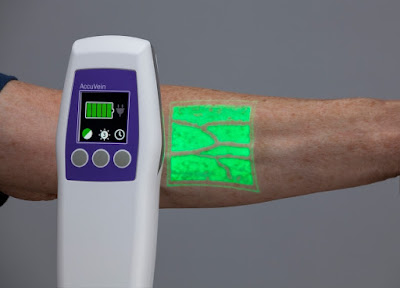
Earlier this week, I had one of my periodic MRIs as a cancer survivor – All clear! During the scan, I get a chemical injected partway through called gadolinium, which allows the scanner to pick up blood flow. Since chemotherapy, my veins have been more constricted than most people's, making it difficult to get the IV in. After a couple failed attempts to get a vein by feel, the tech got out a type of vein-finding device I had never seen before:

AccuVein

This is a little different from the one that was used on me, but the tech was already flustered enough from the two failed pokes without me pulling a camera out. The device projects a square of light with shadows anywhere there's a vein. As was the case when I got an ultrasound, I started asking questions about how it works, only to be met with shrugs.

It turns out the device uses near-infrared light to scan over the area. Blood vessels contain lots of water, which absorbs in the near-infrared region:

Wikipedia

This plot shows the amount of light absorbed by liquid water at different wavelengths. It dips down for the visible spectrum, which is why water appears transparent, but rises quickly on either side. That means the blood vessels will absorb the light put out by the device, instead of reflecting it. It can detect where these gaps in reflection occur, and project an image of the veins on skin.

I've been a cancer patient and survivor for 10 years now, and I'm delighted to keep finding interesting physics in my medical experiences!

Sunday, September 27, 2020

Filtered Photons

Our backyard here in Florida has a lovely screened porch, and whenever I go out there with Lorna, I notice this interesting effect:


The pattern made by the two screens reminded me of an interference pattern, so familiar from quantum mechanics:
Wikipedia

This type of pattern is created by the electromagnetic waves from different sources cancelling each other out, but that's certainly not happening with our screen. Instead, the geometry of the situation leads to the gaps and wires of the mesh aligning in different ways. We can imagine looking through one screen at another moving horizontally:
As the wire from the moving screen passes through the gap of the stationary one, the amount of light is reduced, creating the darker regions seen in the photo. In this case, we're looking through the corner of two screens at right angles:
Because of the different distances between eye and screen, we end up in different points in the wire-gap pattern. I had trouble modeling those differing phases, and I suspect I've made an error somewhere, but the phase relation I get is

where the blue curve is the closer screen, and the red the more distant. That leads to a brightness pattern which looks like

While this does show brighter and darker patches, it seems to bear no resemblance to the type of pattern seen in quantum mechanics. I'm also not confident I have this correct, but I already spent too much time on debugging, so this will have to be another post with an unsatisfying conclusion!

Saturday, August 22, 2020

Itty Bitty Bang

 Another question this week from Papou: Since a Black Hole can continuously acquire mass (except those cases wherein it loses matter per S. Hawking), does it follow that those Black Hole’s Event Horizon is also continuously getting larger. If that were not the case and the Event Horizon continuously reduced its boundary, does it not follow that Black Hole would become a point mass followed by a Big Bang. If that were the case, then it would be irrational that there was only one Big Bang and we are the product of that singular Big Bang. It is more likely, then, that there may have been other Big Bangs and there are other Universes out in Space. Is there anywhere in space where the Red Shift is not consistent with our Big Bang; which would then imply that there may have been multiple Big Bangs.

I think you get my drift ..... basically I am saying:   “Can a Black Hole become a Big Bang? What is the latest Red Shift evidence?


There are a couple different issues at play here, so let's address them one by one. First off, the event horizon of a black hole: A black hole is a region of space where matter has become so dense, light cannot escape its gravitational pull. The size of that space, called the Schwartzschild radius, is proportional to the amount of mass inside it:
where G is the gravitational constant, M is the mass, and c is the speed of light. You can actually find this yourself by looking for when the escape velocity is equal to c. This radius is sometimes called the event horizon, since in Special Relativity, events are described as points in space and time that are observed through light. If light cannot escape the black hole, we cannot observe events within it.

That brings us to the next part of the question: What happens to a black hole over time? As the equation above states, the event horizon radius is directly proportional to the mass within it, so if it loses mass due to Hawking radiation, or gains mass due to objects falling it, the radius can shrink or grow, but for fixed mass, the event horizon should stay fixed. For small black holes, Hawking radiation can eventually reduce the mass to zero, which is believed to result in the black hole evaporating. As the black hole shrinks, it will cross between the theories of General Relativity, and Quantum Mechanics. In their current forms, these theories are incompatible, but it's believed the evaporating black hole would release a burst of gamma rays as it vanished.

Still, there is a connection between event horizons and big bangs: In 2013, a group of scientists proposed that our universe could exist as the event horizon of a black hole in 4 spacial dimensions. In our 3 spatial dimensions, an event horizon is the surface of a sphere, which is 2D. A 4 dimensional black hole though would result in a 3D event horizon. Of course, that implies the possibility of a 2D universe on the event horizons of our universe.

Finally, the connection to red shift: The universe is expanding at every point, which means every point is moving away from every other point. I often find it helpful to imagine a big rubber sheet being stretched outward; any two points drawn on the sheet will get farther apart. As light moves through the universe, its wavelength gets stretched too, making it "redder", i.e. lower frequency. If you point a radio telescope at an empty part of the sky, as Arno Penzias and Robert Wilson did in 1965, you'll find a constant signal in the microwave band of light, called the Cosmic Microwave Background (CMB). This light is distributed in the blackbody spectrum, the range of photons emitted by objects of a given temperature. That temperature is from 380,000 years after the Big Bang, when things had cooled enough for protons and electrons to combine into hydrogen, about 3000 Kelvin. Over the billions of years that light has travelled, it's been red shifted down to around 2.725 Kelvin, in the microwave range.

If you look at a picture of the CMB, you may notice that it's not entirely uniform:
NASA
These anisotropies are mainly due to gravity pulling particles into clumps, which cool differently. Some have suggested the CMB also contains evidence of "bruises" from collisions between our universe and others existing in a larger multiverse. However, no such collisions have been detected so far.

Thanks for another great question, Papou!

Sunday, June 14, 2020

Dentist Time

[Title from my grandfather's favorite joke: When is the best time to go to the dentist? 2:30! (Tooth-hurty)]

Earlier I said I would describe what I'm doing here in Florida, and this week I'm going to talk about my work on LIGO. I'm part of the engineering department here, so rather than the data analysis that I usually do, I'm more involved in the mechanics of the detectors. I described in my first post on LIGO how gravitational waves stretch and squeeze space. That stretching is a proportional factor, so the longer the distance, the greater the change. The scaling factor is so small though that to have any hope of picking it up, we need an enormous distance. The detectors are 2.5 miles long, but on top of that, we use resonant cavities that bounce the laser beam back and forth many times:
The laser goes through two partially-reflective mirrors that concentrate the light in a small area. The mirrors have to be precisely aligned to make the light add, instead of cancel out:
The laser we use in LIGO has a wavelength of 1064 nm, which means the difference between making the peaks add or cancel is only 0.000000266 meters!

This past week I was attending some (virtual) workshops on a tool we use to simulate cavities called Finesse. Adapting some of the code my colleague Luis Ortega wrote, I made a plot of the laser power that builds up in the cavity if we send a 1 Watt laser in, and have 85% reflective mirrors on either end:
One quality of a resonant cavity is how quickly the power falls off when the length is changed. Here you can see that if we have things just right, we can increase the power by 6.5x, but any error, and the output quickly drops to near zero.

The part that I'm working on is making simulations of the suspensions that help prevent the mirrors from moving out of alignment. Maybe in a future post I can discuss that, but I wanted to start with the basics, since I haven't been thinking about this stuff for as long as my coworkers.

Sunday, May 17, 2020

Filling in the Holes

Following up on some previous posts about gravitational wave detections, this week I have some questions from Papou:

How many current black hole collisions are we aware?
Last year, the LIGO/Virgo Collaboration released the first Gravitational-Wave Transient Catalog, covering all the detections from the first and second observing runs. That includes 10 binary black hole (BBH) events, and 1 binary neutron star (BNS) merger. The third observing run is split in two pieces. Results from the first half, O3a, are available on GraceDb, and include 37 BBHs, 6 BNSs, 5 neutron star black hole (NSBH) mergers, and 4 events that fall in the "mass gap".

The mass gap represents a range of masses where we have never seen a black hole or neutron star. This image shows a summary of the compact objects observed by LIGO and electromagnetic astronomers as of the end of O2:
via Northwestern
The empty space between 2 and 5 solar masses is the mass gap. It is unknown what kind of bodies were involved in those mass gap collisions.

What happens to "Matter and Antimatter" when two black holes collide?
Black holes are made of matter. When matter and antimatter combine they make energy, but as with most physical processes, this is reversible: energy can create matter/antimatter pairs. Since the universe contains residual heat energy from the Big Bang, these pairs are constantly forming and annihilating back into energy in space. If one of these pairs forms near a black hole though, the antiparticle can fall into it, while the matter particle escapes. This process is called Hawking radiation, and can lead to a black hole losing mass.

Are photons escaping due to the collision energy?
In the case of black holes, no. Light can't escape a black hole's event horizon, and when two collide, their horizons merge. Neutron star collisions, however, can release photons in the form of a gamma-ray burst (GRB). In an earlier post, I mentioned LIGO's detection of GW170817, which showed a correlation between a binary neutron star merger, and a GRB.

Are the combining gravities simply arithmetic additions or does the total gravity grow in multiples?
Neither! Mass and energy are connected through E = mc^2, so when energy is released in the form of gravitational waves, part of that comes from the masses of the black holes. Despite the extreme sensitivity needed to detect gravitational waves, they carry an enormous amount of energy. The first detection, GW150914, lost about 3 suns worth of mass-energy. I tried to find a way to put that number in perspective, like "X billion nuclear bombs", but it's so huge that it dwarfs even a measure like that. Spacetime is exceptionally stiff stuff, and wrinkling it even a little needs an amount of energy that we don't normally encounter.

Thanks for more great questions, Papou!

Thursday, February 20, 2020

Trip the Light Fantastic

This is another item from my list of ideas, based on a news article from a couple years ago: Idiocy On Ice: Speed Skaters Believe They Go Faster Wearing Blue. It should be pretty obvious that the color of the speed skating suits will have no effect on their speed, beyond a psychological boost, but I wondered what kind of advantage could be made from wearing blue over other colors. The first thing I thought of was another news story from the last few years, the LightSail spacecraft.

Light is made up of photons, which carry momentum. When light hits an object, that momentum can give the object a push. Rather than carry its own fuel, the LightSail is pushed by sunlight to accelerate. The same principle could be used with our speed skater and, say, a laser pointer. Blue light is among the most energetic of visible wavelengths, so using a suit that reflects that color and a corresponding laser to aim at it, we can get the best results.

The momentum of a single photon is given by
where h is Planck's constant and λ is the wavelength. Blue light has a wavelength around 420 nm, which gives a momentum of 1.58 x 10^-27 kg m/s. Since we're bouncing the photons off the skater, we actually get twice the momentum compared to absorbing them. To figure out how many photons we need, we have to find the minimum velocity boost that will give an advantage.

In 2018, the men's speed skating medals were decided by 2 milliseconds over a 5000 meter course! The difference in average velocity was 7.24 x 10^-5 m/s. To get the momentum, we need a mass for the skaters, which this page suggests is around 161 pounds. Comparing that to our per-photon momentum shows we need a total of 1.6 x 10^24 photons to make a difference. The energy in each of those photons is simply the momentum multiplied by the speed of light, so the total energy required is 790 kJ. Delivering that over the 6-minute race time gives 2.1 kilowatts. This is what a 2-kilowatt laser looks like:

Any volunteers?

Saturday, July 27, 2019

Tri Try Tro Trombe

We've been having a heat wave the last couple weeks in Annecy, and Marika and I were discussing the lack of air conditioning here. In spite of that, some buildings remain reasonably cool. Marika, being both an observant nurse and coming from a family of engineers, noticed that most buildings here are made of concrete, rather than the wood/steel buildings we have in the US. While talking to Papou a few nights ago, we mentioned this, and he identified them as Trombe walls.

Trombe walls consist of a concrete bulk, with a layer of glass or reflective coating on the outside.
Simplified from Wikipedia
The key is that UV rays from the Sun are able to pass through the glass and get absorbed by the wall. The wall heats up, which releases infrared light, but these are reflected by the glass, and remain inside. We can see this looking at the spectral reflectance:
Aleksandra Gardecka
Ultraviolet light has wavelength around 0.4 microns, the left edge of this graph, and infrared light is anything from 0.7 microns to 1 mm, beyond the right side of the graph. You can see that in between, the glass goes from mostly transmitting, to mostly reflecting. This means that the UV light will get in, but the re-emitted IR light will be reflected back.

It isn't all about the glass though: The concrete provides a large mass to store the heat when it comes in, and acts as a buffer between the inside and outside. I had hoped to make a simulation of this, but my concept of what happens is that as the weather outside heats up in the day, and cools down at night, those changes are transmitted inside with a delay, as the concrete absorbs and re-emits the heat. That results in the inside being cooler during the day, and warmer at night.

Air conditioning will still cool things better than this method, but this has the advantage of being more eco-friendly. I didn't expect international living to inspire blog posts, but thanks to Marika's observational skills, I've learned something new!

Sunday, May 5, 2019

Reverse the Polarity

[Title from an (in)famous Doctor Who quote]
 

Last night I went to see Avengers: Endgame in 3D, and I can never resist playing with the glasses afterward, so I thought I'd talk a bit about how they work. In order to get a 3D image, your eyes need to get slightly different pictures – You can see this by alternately closing one eye and then the other. For a long time, this was done with glasses that had one red lens and one blue. The two images would be printed in the same red and blue, so each eye could only see one. Unfortunately, this only works for black & white (or in effect, black & purple) images.

Modern 3D films instead use two different polarizations. I've mentioned polarization before talking about sunglasses, and that's basically all the 3D glasses are, with one important difference: Normal polarized sunglasses are linearly polarized, while the kind used for 3D are circularly polarized. You can think of polarization as an arrow pointing perpendicular to the direction the light is traveling. For linear polarization, this arrow is fixed, but for circular polarization it rotates. The polarization in the linear case is usually described as horizontal and vertical, while for circular it is right- or left-handed*.

We need two different images to get the 3D effect, so we could do that with one horizontal filter, and one vertical. The problem is, if you tilt your head, the two images will mix. To avoid that, films use circularly polarized light, with the glasses constructed to filter right- or left-handed polarizations. To make that filtering happen, the light is first transformed into linear polarization, then filtered leading to some interesting effects. Next time you see a 3D movie, I highly recommend playing with the lenses a bit:
Both lenses forward, 90° rotation
One lens reversed, 90° rotation
*In case you're wondering what physicists mean by the handedness of quantities: You're probably used to talking about rotation in terms of clockwise and counter-clockwise. There's a problem with this though, if you imagine a see-through clock. Viewed from the back, the hands appear to be moving counter-clockwise. To remove this ambiguity, physicists take their right hand and curl their fingers in the direction an object is moving. Extending the thumb points in the direction of the rotation vector. In the case of a clock, this points into the wall.

Sunday, January 22, 2017

Something Fishy

The other day, I happened to glance through the peephole of Marika's apartment into the building's lot:
It got me thinking about the wide, but distorted image you get from them, and I thought I'd talk a bit about the optics behind it.

Lenses use refraction to bend light in specific ways.  When a beam passes from one material to another, it changes direction according to the properties of the two substances.  The angle of the change is determined by Snell's law (diagram from Wikipedia):
I've mentioned refraction before, in the context of the Principle of Least Time.  The general rule for refraction is that when a beam passes from a material with lower index to higher index (like air-to-glass) the beam bends toward the perpendicular, and when it passes from higher to lower index, it bends away.

Peepholes use a type of fisheye lens to gather lots of light from the outside, and focus it into a smaller area that can enter your eye:
At the same time, if you try to look from the other side of the door,  all the light from a small spot gets spread out:
That makes the lens essentially one-way, allowing you to see outside, without others seeing inside.  It seems strange to me that we call something designed for privacy and security a "peephole" when the other uses of "peep" I can think of (outside of Easter) are so salacious: "peepshow" and "peeping Tom".  I suppose that's why I'm sticking to physics!