Pages

Sunday, November 26, 2023

Stopping Traffic

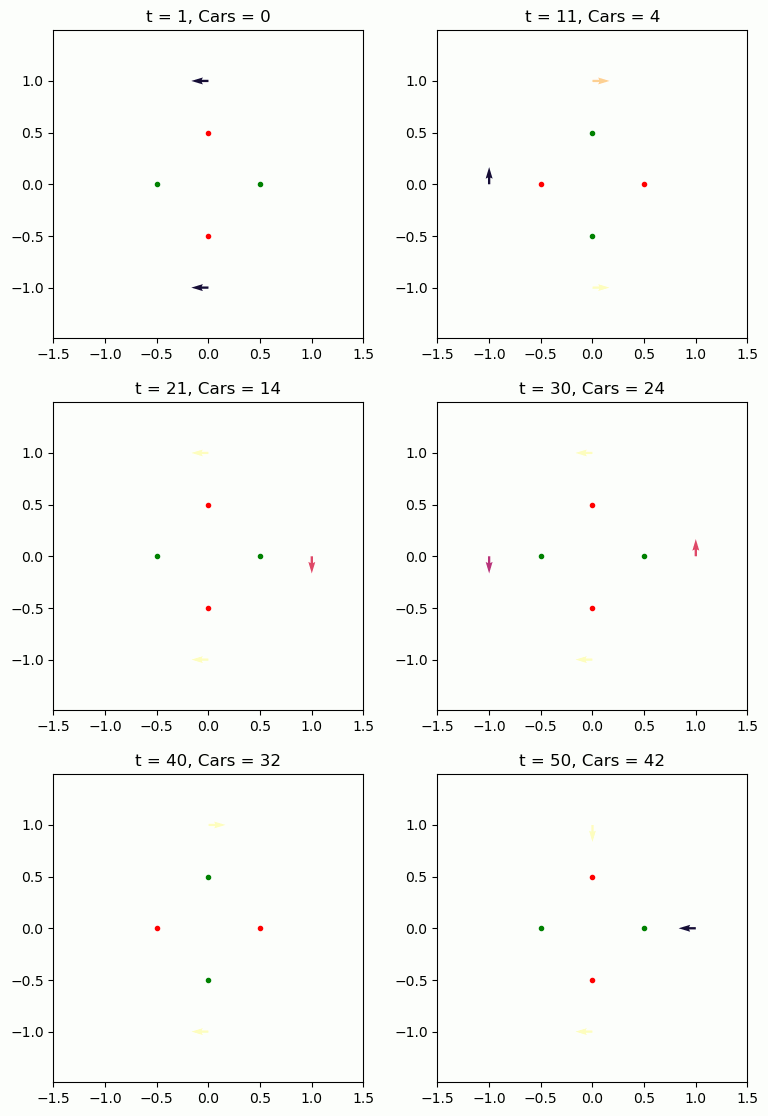
Since coming back to Florida and commuting every day, we've noticed that the traffic lights stay on a particular direction for a long time before switching. This is especially annoying as a pedestrian (who dislikes jaywalking), since it means the walk from the parking lot to my office can vary a lot depending on what lights I hit. I was curious whether I could design a simulation to test the effect of the light duration on the time cars spend waiting.

The setup is a 4-way intersection with lights that swap red/green with separate green durations for North/South and East/West. Each road has a rate cars arrive, and each car randomly chooses to go left, right, or straight. As cars pass through the intersection, we can keep track of how long they had to wait since arriving. Below is an example simulation – The arrows are the lead cars on each road, pointing in their planned direction and colored to indicate how long they've been waiting.

We've got a lot of variables going on here, so it took me a while to figure out how to assess the results. It would take too long to try every combination, so I just sampled from a reasonable-sounding range. I considered using a corner plot to see the effects of the inputs, but the sampling was too sparse to see a trend. One way to reduce the number of parameters is to consider where each car is coming from, and use the traffic rate and light duration from that side. Then I thought about the units: the traffic rate measures cars/time, and the light duration is a time, so multiplying them gives an average number of cars during a green light. Plotting this with the waiting time shows a clear trend:

I separated out the different turning directions, expecting that left turns would need to wait longer, but that doesn't seem to be the case. This shows that to minimize the waiting time, we need to keep the rate*duration small, i.e. for busy roads the lights should change rapidly, which is not what I expected.

This also implies that the Florida lights are expecting a low rate of traffic – Not our experience the past few weeks coming home during rush hour and hitting gridlock! Of course, this model may be inaccurate, and I should stick to gravitational waves, rather than civil engineering.
Sunday, November 19, 2023

Dribble Cup

Earlier this week, I took my water bottle out of the fridge and, without thinking, put it near the small heater we had running. In seconds it was spewing water all over the table!

I figured the heat made the air at the top expand, pushing the water out through the straw, but what I was really curious about was: Does the amount of air the bottle starts with change how much water is forced out?

Air follows the Ideal Gas Law, which is given by

where P is pressure, V volume, N number of molecules, k Boltzmann's constant, and T temperature in Kelvin. That last bit is important: We usually measure temperature in degrees Fahrenheit or Celsius, which can be negative. Kelvin on the other hand is only ever positive: 0 K corresponds to absolute zero. We can convert from Fahrenheit with

In our situation, the temperature rises, which increases the pressure the air applies to the surface of the water. This pushes water out, increasing the air's volume, and bringing the pressure down. At equilibrium then, we can set the initial and final pressures equal. Similarly, the number of molecules won't change, since no air is entering or exiting. Using that, we can write the ideal gas law for the initial and final states, then set them equal:

What we're really interested in though is the change in volume, since that tells how much of a mess we're making:

We can plot this for a couple different initial volumes over the temperature range from refrigerator to heater-adjacent:

The green line is half full for my water bottle, and will spit out a couple tablespoons worth! As I write this, Marika is using the Instant Pot for some dinner prep – I'm surrounded by pressure vessels ready to blow!

Sunday, November 12, 2023

Vanishing Trick

Back in March, I was at the LIGO/Virgo/KAGRA meeting, and during breakfast one morning, a fellow researcher posed an interesting question: Suppose a cluster of stars are all moving in the same direction. What can we learn from their vanishing point?

The concept of a vanishing point is often used in art: When parallel lines recede into the distance, they appear to converge at a point on the horizon. It seems logical then that our parallel stars will also converge to a point in the sky, which could tell us about how they're arranged in space. First though, we need to be able to generate a set of parallel lines in 3 dimensions. In 2D, this is fairly simple: Any lines with the same slope but different intercepts will be parallel. I found a page giving a simple way to express 3D parallel lines using a "double-equals" form:

The intercepts for each line are different, but the slopes associated with each dimension must be proportional between the lines.

This format is a bit difficult to imagine plotting, but we can fix that by setting the three terms equal to a parameter t, and then solving:

Once we have the paths in x, y, z, we can transform them into the right ascension and declination angles used by astronomers:

We have all the machinery in place now, so let's try it on a trio of lines. First, we can look at them in 3D, to check that we got parallel lines as expected:

Looks good! Now we'll run it through the projection...

Uh oh, the three lines don't share the same vanishing point! For a while I was sure I had made a mistake somewhere, but I think this can be explained by the fact that we're projecting onto a sphere, not a plane, as is usually done. I made a feeble effort at proving this to myself, but we're still running ourselves ragged getting things set up in our new home in Florida (hence the long silence here)!