Pages

Showing posts with label Geometry. Show all posts

Sunday, April 13, 2025

Tess-Elation

This week something brought to mind a computer program I had growing up called TesselMania. It was a kids' art program for making tessellations, a type of repeating tiling of a plane. What stuck in my mind as I thought back to it was the question of how to generate such tilings – The program let you manipulate a shape, but it would make changes in reaction to your adjustments to maintain the necessary symmetries. I wondered what the precise rules were for maintaining a shape that could be tessellated.

I couldn't find a really general technique – I imagined there would be a wealth of math papers on the topic, but maybe I didn't dig deep enough. What I did find was an Instructables page about making tessellations with paper tiles. This gave a good recipe I could follow for my own program:

  1. Start with a square tile
  2. Cut a shape from the top side of the tile
  3. Rotate the shape around the top right corner of the square to join it to the right side
  4. Cut a shape from the bottom of the tile
  5. Rotate the shape around the bottom left corner of the square to join it to the left side

I was able to translate this into a Python script which works nicely! As above, I start with a square and divide the top and bottom lines into N points. Each point gets displaced randomly up or down, and then we apply the transforms described to get the sides. Once we have one tile, we can rotate it around the corners to make a grid:

N = 4

N = 6

N = 10

I was pretty happy with this, but a little unsatisfied with the spikiness – To me, tessellations with curvy bits feel more impressive. I wondered if I could take the points I was using to make the tiles and run them through a spline interpolator to smooth things out. For a simple solution, that gave some nice results:

N = 4

N = 6

N = 10

The N = 10 case is still a bit spiky, but 4 and 6 have some nice blobbiness! Still missing is fully interlocking designs, since that would require a more complicated definition of the tile edges, but since it's been over a month since I last got something up here, I thought I should do my best to wrap something up, rather than let it sit forever in my growing "Unfinished" folder. If there are any other TesselMania fans out there, I hope you'll give my script a try!

Saturday, February 22, 2025

Window's Vista

This week, Futility Closet had a post about the Vista Paradox. The paradox is connected to an effect I discussed before, where the angular nature of our vision causes objects to move in unexpected ways. In this case, we're viewing a distant tower through a window. As we approach the window, the window takes up proportionately more of our vision that the tower, causing it to appear to shrink. I tried making an animation of this to test my understanding:

As expected, the tower (red) changes very little, while the closer window (blue) expands rapidly. Initially, I was concerned with how the window's proportions appear to change, but I checked with my mother Sally, and she gets the same expression I did. There still may be an error in my implementation though.

After reading the Futility Closet post, I was reminded of an effect often used in filmmaking called a Dolly Zoom: The camera moves forward (backward) while zooming out (in), causing the edges of the frame to stay where they are, but the center to contract (expand). The scene that always comes to my mind for this is one from Fellowship of the Ring:

makeagif

Using the same framework as above, I plotted a series of rings at different distances, but the same size. Then I moved the camera toward them, while fixing the edges of the plot to the nearest ring:

This effect makes the center appear to shrink, the opposite of the motion in the film, but exactly the same technique. It's neat to see this artifact of human perception appear in both architecture and filmmaking!

Sunday, October 13, 2024

Zooming On My Cycle

I started my job with the University of Florida in April 2020, right as the COVID work-from-home policies were starting up. As a result, all my meetings are conducted over Zoom. Now and then I get a little bored with the subject at hand (but only very rarely!) and I start thinking about the layout of the meeting participants on my screen:

I try to move my mouse from each window to an adjacent one, visiting each once and returning to the start. This type of problem is the subject of graph theory, which assesses the attributes of nodes (the windows in this case), which are connected by edges (whether two windows are adjacent). The quality we're looking for is called a Hamiltonian cycle. My various meetings have different numbers of participants, and I've been fascinated by whether a given arrangement contains one or more of these cycles.

It turns out this problem is in a category called NP-complete, which is broadly defined as problems that are hard to find solutions for, but easy to check if a given answer works. In this case, given a path through the windows, it's easy to check we visit each once and end at the start, but the only way to find those is to check every possible path. As long as the number of nodes is small, this isn't too taxing, but the complexity scales quickly as we add more people.

Luckily, Zoom only puts 25 people on the screen at a time, and will break the group into pages if there are more. That means I can make a script to test every case! I used the package NetworkX to handle the connections between nodes, which let me generate paths to check. The animation below pages through different numbers of meeting participants, and gives the number of unique cycles at the top.

I find it really interesting how the number of cycles relates to the number of nodes: Even ignoring the drops to zero, the numbers aren't strictly increasing. I'm also surprised by the high numbers of cycles for the bigger groups – I usually only find 1 or 2 before I manage to refocus on the meeting!

Sunday, June 30, 2024

Angle of the Dangle

Since last year, Steve has been confined to a wheelchair. He gets in and out of it with help from a device called a Hoyer Lift:

Hillrom

The straps at the head and legs have several different notches to adjust the length from the hoist attachments. Along with those adjustments, Steve can also lie higher or lower in the sling, and adjust the angle between his legs and torso. Given these options then, Sally asks: How do we adjust things to get Steve to be more/less upright?

This turns out to be a surprisingly complicated geometry problem. I started off by diagramming it this way:

a and b are the lengths of the two straps, L is Steve's height, h is how far down the pad he's positioned, and θ is the leg-torso angle. We can use the Law of Cosines to first find the width of the two triangles, w, and then the angle between the lift straps:

What we need to figure out from here is the coordinates of that lowest point, where the sling bends. To do that, I rotated the setup so that a lay on the x-axis, and worked out the geometry from there. If the point we want is at (x,y) in these coordinates, then we can write

Solving these 4 equations together produces pages of messy equations, so instead I decided to do it numerically. Since my goal was to make an interactive tool my parents could use, I'm working in JavaScript, so I had to make my own equation solver. I decided to use the bisection method, in which we find the point where a function crosses zero by bracketing it more and more finely. For some combinations of parameters the algorithm fails to find a solution, and the angles don't always look right, but I think it can give a feel for how these different choices factor into the final angle that the lift rests. You can see the code here, or just play with it below!

Saturday, March 2, 2024

Circumferential Evidence

Shortly before starting our move to Florida last year, we took our car to have all 4 tires replaced for the 1000 mile trip. On our way back from the dealer, the car's tire pressure monitoring system went off, warning that one or more tires were not properly filled. We checked each one after we got home and all were fine – Consulting the manual told us the system often gives false positives after tire replacements, and needed to be reset. Clearly the system was not directly measuring the pressure, so I was curious how these work. I found a nice explanation from Bridgestone Tire: The system measures the revolution speed of the tire and compares to the speed over the road, in effect measuring the tires' circumference. What I wanted to know is, what sort of conversion is needed to get from circumference to pressure?

The effect of lower pressure will be for the tires to ride lower to the ground, flattening against the road. Here's how I imagined it:

Here the tire has inner radius r, outer radius R, and the axel is a height h above the road. Initially, I tried to figure out the pressure directly: Each tire is applying a force to hold the car up, and force is equal to pressure times the area of the contact patch. That was a bit of a mess, but I realized to detect an under inflated tire, we can instead look at the volume of air inside, which is related to the pressure through the ideal gas law. That turns this into a geometry problem: We want to find the perimeter and area of a circle with a wedge replaced by a triangle. Skipping some intermediate steps, the perimeter is

and the area is

To get the volume, we can just multiply by the width, w, of the tire. To put some numbers to this though, we have to enter the arcane realm of tire sizing.

Our car uses tires of size P235/55R19. The first number tells us the width in millimeters. The number after the slash is the "aspect ratio", which is a percentage given by (R-r)/w. Things get even weirder from there, since the third number is the wheel diameter, equal to 2r, in inches! We can combine these measurements (after converting to a single system of units) to get r, R, and w, then plug those in along with a couple values for h. We can then look at how the tire circumference changes with volume of air lost from the tire:

This plot covers the range from fully inflated to riding on the rims, so I was surprised it stayed so linear. While thinking about this, I remembered an episode of Mythbusters where they looked at improved gas mileage from over-inflated tires – Here's a similar analysis from Popular Mechanics. That article attributes the effect to lower rolling resistance, but my results make me wonder if part of it is getting increased circumference, resulting in the same number of revolutions taking you a greater distance: For the two ends of the plot above, each mile could require 693 to 718 revolutions.

Sunday, November 12, 2023

Vanishing Trick

Back in March, I was at the LIGO/Virgo/KAGRA meeting, and during breakfast one morning, a fellow researcher posed an interesting question: Suppose a cluster of stars are all moving in the same direction. What can we learn from their vanishing point?

The concept of a vanishing point is often used in art: When parallel lines recede into the distance, they appear to converge at a point on the horizon. It seems logical then that our parallel stars will also converge to a point in the sky, which could tell us about how they're arranged in space. First though, we need to be able to generate a set of parallel lines in 3 dimensions. In 2D, this is fairly simple: Any lines with the same slope but different intercepts will be parallel. I found a page giving a simple way to express 3D parallel lines using a "double-equals" form:

The intercepts for each line are different, but the slopes associated with each dimension must be proportional between the lines.

This format is a bit difficult to imagine plotting, but we can fix that by setting the three terms equal to a parameter t, and then solving:

Once we have the paths in x, y, z, we can transform them into the right ascension and declination angles used by astronomers:

We have all the machinery in place now, so let's try it on a trio of lines. First, we can look at them in 3D, to check that we got parallel lines as expected:

Looks good! Now we'll run it through the projection...

Uh oh, the three lines don't share the same vanishing point! For a while I was sure I had made a mistake somewhere, but I think this can be explained by the fact that we're projecting onto a sphere, not a plane, as is usually done. I made a feeble effort at proving this to myself, but we're still running ourselves ragged getting things set up in our new home in Florida (hence the long silence here)!

Sunday, September 17, 2023

On My Soapbox

I've been applying to a bunch of faculty positions recently, and one requested a recorded teaching sample. I made this, giving an introduction to special relativity. Questions & feedback are welcome!


Saturday, August 12, 2023

Maximized Magnets

Recently another post from Hack-a-Day caught my eye, discussing a technique for stacking magnets to get a stronger field, called a Halbach Array. You might assume that if you have a bunch of small magnets, the best way to combine them would be stack them with all their poles pointing in the same direction, but it turns out you can get a stronger field by stacking them in an unintuitive pattern:

Wikipedia

The arrows point from south to north pole of each magnet. Using the (wonderfully named) Python package Magpylib we can look at the magnetic field produced by this combination:

The field strength is represented by a higher density of lines, but that's a little hard to read off this plot, so we can also plot the overall magnitude of the field on a line just above and just below the magnets:

Not only is the field stronger than a single magnet's, it's stronger on one side than the other! This gave me pause, since it sounded like a monopole magnet, which is forbidden by Maxwell's Equations, specifically Gauss's Law for Magnets:

This says that for any closed surface S, all the field lines going out of the surface need to be matched with lines coming in, so that the sum cancels. It seems like our setup could have more lines going out the bottom than coming in the top, but the key is that even though the magnitude of the field is stronger on one side of the array, it includes both north and south poles. You can see this in the field plot above: there are lines going in and out on both sides. We can double check by integrating around a box as S:

When the loop closes, we're back to zero, and no laws are violated!

That last section may have been a little technical, so I'd like to end on something (I find) beautiful. In the Wikipedia article for Halbach arrays, they mention a version using magnetic rods, which can be rotated to switch the field from one side to the other. I was curious how the field strength varied during this, so I made an animation with the output from Magpylib:

The dots mark the north pole of each rod. Each 90° rotation swaps the strong side, but I think the movement of the 3 low-field nodes is really cool. Thanks, Hack-a-Day, for introducing me to this nifty structure!

Saturday, April 29, 2023

A Con-Vexing Problem

This week in my research I've been trying to produce some figures that will go into a paper on the work I've been doing modeling the LIGO pendulums. The models use a tool from engineering called finite element analysis (FEA), which represent an object as a set of small pieces, called elements, which each have a number of properties assigned to them. For each element, we can calculate the forces applied to it to find how it moves and interacts with the surrounding elements. The problem I was having though was, given a set of these elements that make up a part, how do we find the outline of that part?

To make things more mathematical, I have a set of points in 2 dimensions (since I'm just looking for a top-down view), and I want to find a closed curve that contains all the points, but has the minimum area. As a zeroth-order approximation, we could just use a box with the minimum/maximum coordinates of all the points as the corners. That doesn't work very well for the set of points I was dealing with though:

Since this stage of the pendulum is tilted in these coordinates, we end up including a lot of empty space. We could do a little better if we rotated our box, but we're still not going to do great with right angles.

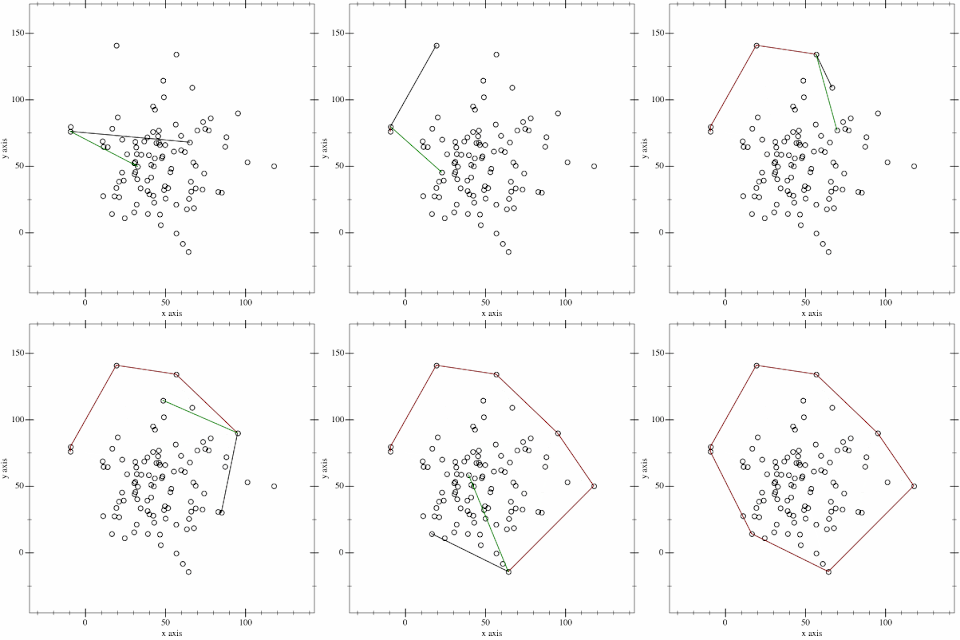
Another option is to try to find a convex hull. To get an idea what this looks like, you can imagine stretching a rubber band around the points. One method for finding the path is called the gift-wrapping algorithm, since it touches only the outer-most points, like wrapping a present. The algorithm builds up the path by looking for the largest angle to the next point. Wikipedia has a nice animation of this:

Wikipedia

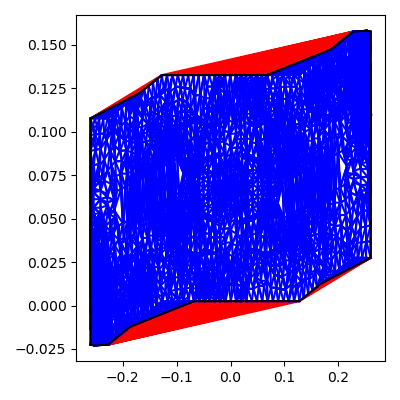
Unfortunately, this only works for convex curves, meaning the shape can't have dents, like our point set does. That brings us to the idea of alpha shapes. These start by dividing the shape into a set of triangles. Each triangle can be assigned a radius based on the size of the circle that would be needed to surround them. We throw out any triangles with radius larger than a given value, then find all the edges that belong to only one triangle – This is the border of our shape. Below are two examples of this for different alpha values, which correspond to the inverse of the radius limit. The red triangles are those that don't pass the limit.

α = 1


α = 2

Below is a comparison of the borders for a couple values of alpha. The first plot is the convex hull, using the Jarvis algorithm, another name for the gift-wrapping algorithm. The second plot, with α = 0, is the same, since that corresponds to an infinite radius, so all the red triangles from above get included.


Once the paper is more complete, I may discuss it here in full, but I'm glad I was able to learn about this technique, so my figures can be a bit more informative.

Sunday, April 2, 2023

Ring Around the 'Rora

Recently I started reading a page called Michigan Aurora Chasers, which shares pictures of the aurora taken in our current home state. The pictures are incredible, but I was really interested by a post that came up discussing Newton's Rings, an effect that can sometimes appear when viewing light from a monochromatic source through a series of lenses, like a camera.

Wikipedia has an example of the effect in a microscope, viewing a sodium lamp:

Wikipedia

For aurora viewers, this happens due to using a flat filter over their curved camera lens. When the light passes through the filter, some will bounce between the lens and filter one or more times, changing the phase. This light can then interfere with the light that passed straight through, producing the dark fringes seen above. The extra distance traveled by the light changes depending on how far from the center of the lens it hits:


The wavelength of light also changes how these rings will appear, since the total phase change from bouncing once from each surface is φ = 4πd/λ, where d is the distance between the filter and lens, and λ is the wavelength. We can scan through the visible wavelengths to see how the pattern of fringes changes (thanks to John D. Cook for the wavelength/RGB conversion):
Due to the spherical shape of the lens, as we get farther from the center, the distance changes more rapidly. This means that if we add up several wavelengths (since true monochromatic light is rare in nature), we see that the rings are only visible near the center of the image, as in the aurora photos from the link at the top:

Our area of Michigan is a bit too far south to get to see the aurora in our own sky, so it's been great to get to see the amazing pictures the group members post. On top of that, they introduced me to this really neat optical effect – Thanks Michigan Aurora Chasers!

Sunday, September 25, 2022

A Parallax to Grind

Marika and I have an Apple TV, and if we leave it paused for a while, it goes into a screensaver panning over various scenes. One of these caught my eye, a view of the Isle of Skye in Scotland. If you skip near the end, you'll see an interesting effect where two pieces of land are moving by at different speeds, even though the camera is moving at a constant speed. This is due to the parallax effect, and I was curious what I could learn from their movement, similar to my earlier post on the angle of the Moon.

When light hits our eye, our brains translate the angle the light enters into a position. The angle of an object at x horizontal to our eye, and a distance d away will appear at an angle off center of
If we move horizontally, we change x, so for a constant velocity v the angle will change by
What this means is that even for the same camera position and speed, two objects will have different angular velocities based on their distance. We can visualize this with an animated plot:
On the left, we have the top-down view, where we see two objects moving past the camera at the bottom. On the right is the camera's view, where we can see that even though the blue begins ahead of the red, as we pass the objects, the closer red one races ahead. We can try to relate their speeds by using the equation for theta's change twice: the velocity and horizontal positions are the same for both, but the distances are different. Putting the two equations together gives
which says that if we take measurements at a few different horizontal positions, we'll be able to find a ratio between the distances, but not their individual values.

You may have noticed earlier I specified a single eye – Because we have two eyes, our brains can use this process without needing to move to find relative distances. This method also connects to astronomy: One way to measure the distance to a star is to observe it at different points in the Earth's revolution around the Sun – A planet-sized pair of binoculars!

Saturday, December 19, 2020

Putting the Squeeze on 'Em

As I went to get some shampoo in the shower earlier this week, I had a familiar experience: The bottle was running low, so we stored it upside down. Sometimes the air trapped inside is at a higher pressure than the surrounding air, which causes shampoo to be forced out by the extra pressure. Normally, I'd stop this by squeezing the bottle in a way to suck the shampoo back in, but the brand we have right now uses bottles with a circular cross-section, so that didn't work. It did get me thinking about how the right geometry lets me control the pressure inside the bottle.


Most of the shampoo bottles I've used in the past have had a cross-section that's roughly elliptical, which have an area of


where a and b are the half-width, and half-height. If I squeeze on the longer axis, I can shrink a and expand b, which changes the area:


We need to choose a precise relationship between a and b – I decided the ellipse should have a constant perimeter. That can be calculated with

Unfortunately, there's no closed-form solution for this, so instead I set up a Python script to calculate it. The pressure in the bottle will be inversely proportional to the volume, which for any cylindrical shape is just the area times the height, so we can write
where p and A are the initial pressure and area. Now, given a change in a, we can find the value of b that keeps the perimeter constant, then get the area, and then the change in pressure. Using a fixed value of 1 for the initial b size, we can try a couple different values for the initial a size to see how they react to squeezing:

Increasing the width by squeezing along the smaller axis always increases the pressure, which makes the shampoo come out of the bottle. The wider the large axis is, the more difference squeezing it makes, but if a = b = 1 like the bottles we were finishing, then any amount of squeezing will increase the pressure, resulting in too much shampoo!