Pages

Showing posts with label Mathematics. Show all posts

Sunday, October 13, 2024

Zooming On My Cycle

I started my job with the University of Florida in April 2020, right as the COVID work-from-home policies were starting up. As a result, all my meetings are conducted over Zoom. Now and then I get a little bored with the subject at hand (but only very rarely!) and I start thinking about the layout of the meeting participants on my screen:

I try to move my mouse from each window to an adjacent one, visiting each once and returning to the start. This type of problem is the subject of graph theory, which assesses the attributes of nodes (the windows in this case), which are connected by edges (whether two windows are adjacent). The quality we're looking for is called a Hamiltonian cycle. My various meetings have different numbers of participants, and I've been fascinated by whether a given arrangement contains one or more of these cycles.

It turns out this problem is in a category called NP-complete, which is broadly defined as problems that are hard to find solutions for, but easy to check if a given answer works. In this case, given a path through the windows, it's easy to check we visit each once and end at the start, but the only way to find those is to check every possible path. As long as the number of nodes is small, this isn't too taxing, but the complexity scales quickly as we add more people.

Luckily, Zoom only puts 25 people on the screen at a time, and will break the group into pages if there are more. That means I can make a script to test every case! I used the package NetworkX to handle the connections between nodes, which let me generate paths to check. The animation below pages through different numbers of meeting participants, and gives the number of unique cycles at the top.

I find it really interesting how the number of cycles relates to the number of nodes: Even ignoring the drops to zero, the numbers aren't strictly increasing. I'm also surprised by the high numbers of cycles for the bigger groups – I usually only find 1 or 2 before I manage to refocus on the meeting!

Sunday, June 2, 2024

Kibble Quibble

We recently got a new bag of food for our dog Eros, and we try to taper him off the old food, since he has a sensitive stomach. As I was serving it up this morning, I got to thinking about how the mixture of foods changes depending on how long we spread the transition. If every day we feed him a total amount d, and we spread T days of old food across b days, we can write

where r is the rate we swap the foods. This is the series for the triangle numbers, so we can replace the sum and solve for the rate:

Using this, we can look at how the rate changes depending on the total amount, and the number of days we spread across:

Note that we require b > T, since otherwise we'd be giving more than a day's food in a day. Since b and T are both measured in days, I wondered if the ratio, representing how much we spread out the old food, had a clear relation to the rate of change in the mixture.

I expected that the points would all fall on a single curve, but there seems to be some variation depending on the specific values for b and T. 

Whenever I hear Eros's stomach making terrible noises, I'm reminded of a bit from Terry Pratchett's Guards! Guards! – "No wonder dragons were always ill. They relied on permanent stomach trouble for supplies of fuel. Most of their brain power was taken up with controlling the complexities of their digestion, which could distill flame-producing fuels from the most unlikely ingredients. They could even rearrange their internal plumbing overnight to deal with difficult processes. They lived on a chemical knife-edge the whole time. One misplaced hiccup and they were geography."

Sunday, August 6, 2023

Nega Millions

The Mega Millions lottery has been in the news a bunch lately, due to the growing jackpot, and I wondered how big the jackpot would need to be for it to be worthwhile to play. Specifically, I was curious about the relationship between the jackpot and the number of players, and exactly how unlikely winning is.

In many articles I found, like the one above, I saw the probability quoted as 1 in about 300 million, but I wanted to go through it myself: As of 2017, the drawing involves 5 numbers chosen from a set of 70, and 1 chosen from a set of 25. The order doesn't matter, so we can write this as

where the exclamation mark is the factorial operator, defined as n! = n*(n-1)*(n-2)*...*2*1. If you do this calculation, you'll find the number given elsewhere – Initially, I thought the order did matter, in which case the 5! would be left out, and there would be significantly more possibilities.

The total jackpot starts at $20 million, and then grows based on the number of tickets sold. We can look at how the jackpot has changed over the past year:

Each time the jackpot is won, it drops back to the baseline $20 million. The slope of the climb depends on the number of players – Note that as the jackpot increases, the slope of the curve also increases. When discussing outcomes with different probabilities, mathematicians often use the expectation value, a weighted average using the probabilities as weights. Since multiple winners split the jackpot, we can write the expectation value for the payout as

The chance of winning is 1/C; the chance of not winning then is (1 - 1/C). If k people out of N players win, we can raise the respective probabilities to the power of k and N-k to compound them. Now we can look at the relationship between the jackpot, number of players, and expected payout:

A couple interesting features of this plot: $500 million appears to be a threshold for a lot of people – The slope of the points increases here, suggesting people outside the set of regular players have joined in. Due to the low chances of winning, the expected value only barely passes $4, although that does exceed the purchase price of $2, so buying a ticket is "worth it" (if you ignore the time cost of buying the ticket and checking the numbers). The low win probability also means that the multiple winner aspect is pretty insignificant. For the numbers I used here, it didn't seem to change anything from the base winning number.

Th other thing I was interested in was how many drawings passed between wins. We can split the data up based on when the jackpot resets to $20 million, and then plot the curves on top of each other:

There are several that last only a couple days, but I was really surprised that the longer-lasting ones have almost identical changes in the number of players over time. That suggests the threshold behavior I mentioned earlier also applies on a smaller scale: As the jackpot grows, there's a continuous increase in the number of people willing to take the chance.

Going into this, I was already confident that playing the lottery was a terrible idea, but to me the expected value really drove that idea home: Even a record-setting jackpot will only barely push you over the break-even point.

Saturday, August 6, 2022

Art is not My Fourier

A while ago, I saw this interesting video about Fourier series, a mathematical tool often used in physics. What really caught my attention was the demonstration of using the series to draw a picture, and how the picture changes as the number of terms increases. I was curious if I could come up with a way to apply this to any given picture.

Before getting into that though, I should give an idea of what a Fourier series is. If you have 25 minutes, the video above is really great, but basically a Fourier series allows us to express a periodic function as a sum of all the different frequencies involved. Here's a nice example from Wikipedia showing an approximation of a square wave using the first 6 terms of the Fourier series:

Wikipedia

We can extend this idea to 2 dimensions using the complex Fourier series. This replaces sine and cosine with the complex exponential. Again, if you want more details, I highly recommend the video above. What it boils down to is that we draw our image with the sum of a bunch of arrows, each rotating at a fixed rate.

Since we need a periodic function in order to make a (finite) Fourier series, we need to use an image that consists of a single unbroken curve. In the video, the examples are all simple line drawings, but I hoped to find a way to convert an image to such a curve automatically. Lucky for me, such algorithms have been developed for use with CNC machines and laser engravers. These require a path for the tool to follow to trace out an image. I found some Python code that accomplishes this by finding the edges of shapes and linking them into paths.

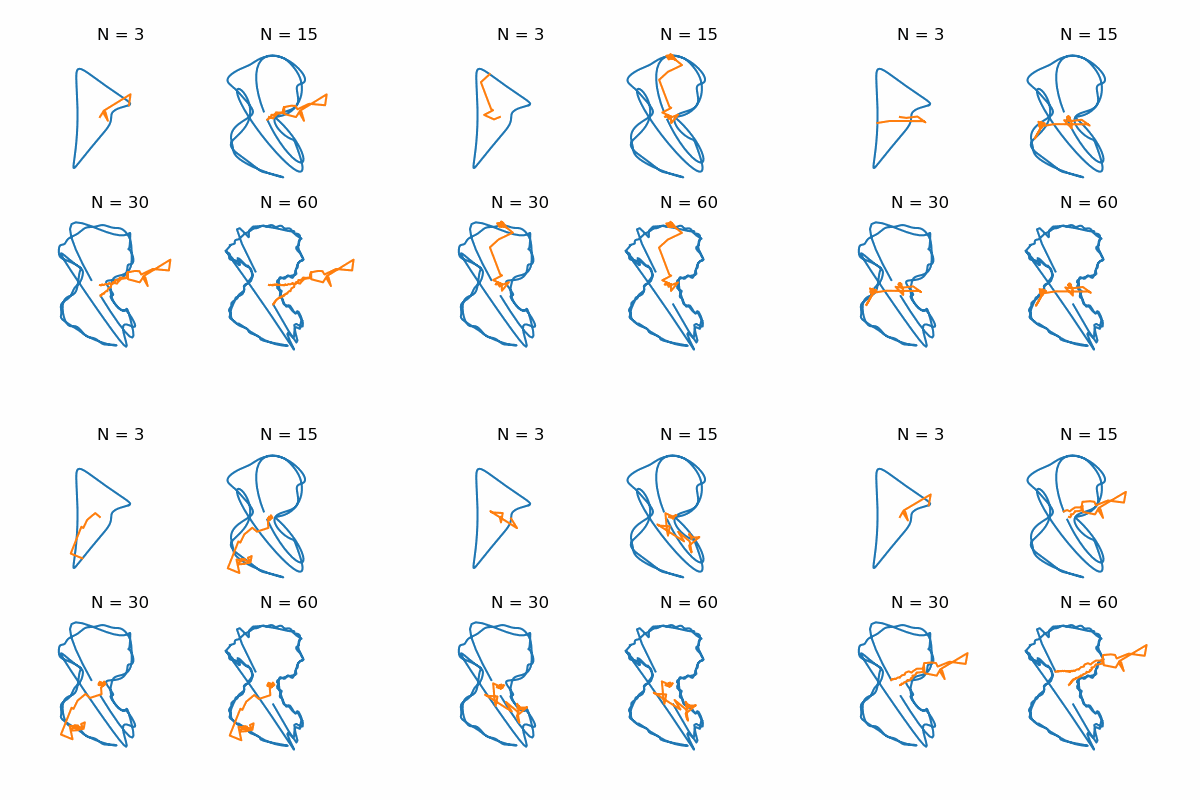
The specific question I was curious about was how the image changes depending on the number of terms. With only a single term, for example, we'd just draw a circle. As the number increases, we get more of the fine details. You can try the code yourself here – I found simple images work best. Photo quality images tend to have too much shading, which doesn't lend itself to reducing the number of terms.

As a first try, I drew a simple smiley, on the principle that it's mostly circles:


The orange lines show each rotating arrow. Pretty quickly the outer circle asserts itself, but the small eyes take some time to appear. After a bit of experimentation with different images, I realized the ideal case for my method was a silhouette. Here's one of an airplane using the same orders of terms:

Based on Wikipedia

Of course, when we talk about silhouettes, we usually imagine people, so here's one I found of Jane Austen:

Based on Wikipedia

It's interesting how the pointier bits of her profile move around: First nose, then bun. This is another of those post ideas that's been lying around for a while since I assumed it would be prohibitively difficult, but once I found that line tracing code it was a snap! I hope if you find this interesting you'll give it a try, and share the results.

Saturday, April 24, 2021

Birthday Bifurcation

Today is my 32nd birthday, and since 32 is 2^5, or 0b100000 in binary, I've got binary trees on my mind! A binary tree is a way to order data, and assign labels to groups. The typical structure is that you have a collection of connected nodes. Each node branches to two nodes below it, usually representing things less than, and greater than the head node. In the case of my life, we can consider things before and after I was 16, then things before and after I was 8, and so on, splitting in half each time. For example, here are all the places I've lived:


Because there's a green dot at the 1/2 level, we can tell I lived at least half my life in Ashfield, and the red dot at 1/8 means it took more than 12% of my life to get my PhD!

I'm now 10 years out from my cancer treatment, and so life sans brain tumor is growing in size:

On a lighter note, I'm now 4 years into marriage with a wonderful woman, without whom I could not have made it this far:


Marika and I have only been together for 1/8 of my life so far, but she is a bigger part of my life than I can ever express. I look forward to many more birthdays together to come!

Sunday, November 22, 2020

Sowing Division

We have several recipes that make 6 servings, and I always have a hard time dividing them equally. It seems I have an easier time splitting things in 2 rather than 3 or other divisions – I assumed this was a human tendency, but I can't turn up anything from searches. While cutting up a casserole one evening, I started thinking about how after cutting 1/3, the next cut would be half of 2/3. Instead of making that cut, I could mark the half and then flip the relation: I have a new 1/3, and I can split the remaining 2/3 in half.

We can put this idea in more mathematical terms: I want to place points a and b on a line of length 1 so that a = 1/3 and b = 2/3, but I can only put them at halfway points. If we start with a0, then b0 goes at (1 + a0)/2. If we keep going back and forth, then

Writing out the first few terms of the sequence for a lets us identify it:
The term in the parentheses is a geometric series, which can be replaced with a simple form. After some rearranging, we get

I realized this technique could be applied to any number of cuts by adjusting each to the center of the two neighboring cuts. Finding an expression for the general case is "left as an exercise to the reader" (textbook cop-out) – I just tossed the algorithm into Python. The main thing I was interested in was how long it takes to get an accurate estimate of the divisions, so I plotted the RMS error at each step:

Each line represents a different number of cuts. Notice that the y scale is logarithmic, meaning these straight lines actually represent exponential decreases. The line for 2 cuts into 3 pieces drops so quickly, it appears to run into some precision error. As the number of cuts increases though, the error is much more difficult to reduce. To get a more concrete handle on this plot, I also made an animation of the cuts as we make iterations:
For the first step, the divisions are evenly distributed at the two endpoints, which is really a worst case scenario. However, we can see how quickly the 2 cuts on the first line settle in place. Moving up the plot, each line takes a little longer to stabilize.

I'm not sure my serving-precision needs are high enough to require actually using this technique, but it was interesting to think through!

Tuesday, April 7, 2020

By Hook or By Crook

[Title from the opening of The Prisoner.]

Marika and I are back at her parents' house until we move to my next postdoc, and I've noticed something about the clock/timer on their stove. If I stand too close, the curve of the front cover blocks the tops of the digits:

Generally I'm able to read the time while only seeing the bottoms of the digits, and it got me wondering about the amount of information carried in each segment.

Digital clocks use 7-segment LEDs, which are laid out like this:
Wikipedia
We can make a table of the segments used for each digit:


abcdefg
0
1


2

3

4


5

6
7


8
9

Now we can imagine removing one or more columns from that table, and see which digits are still distinguishable. I put together a Python script to try out all the possibilities, but I struggled to find a good way to show all 126 of them. I settled on an animated GIF:

You can think of the red cells as ones that are known to be blocked, or burnt out. The list at the bottom shows the digits that remain unique. Interestingly, the lower-right cell is used in all digits except 2, so as long as that one works and is off, we know the digit is 2.

Turning to the situation above, the available digits are fairly slim:
However, since this is a clock/timer, we know the digits will be changing sequentially. For half of the possible digits, we only need to wait for at most the next one to be on a known value.

Saturday, March 28, 2020

Exponential Exposé

With Michigan and most other places in the world sheltering from COVID-19, I thought it might be interesting to talk about exponential growth, and how it relates to disease spread. Disease is transferred from one person to others, so the number of new people who get a disease is related to the number who have it now. We can write that as a differential equation:
N is the number of people with the virus, and the dot indicates the change in time. τ is a time constant that tells how quickly the disease spreads. Solving this equation gives
At t = 0, we have one case, and after every τ, the number increases by a factor of e (= 2.71828).

A couple days ago, the blog Hack-a-Day (which I've mentioned before) had a post about getting realtime data about COVID-19 statistics. I wrote up a Python script to pull the data we're interested in, and make some plots. First, we can look at the total number of US cases over time:
According to the equations above, if we look at the increase from day to day, it should be linearly related to the number of cases on that day. Plotting gives
There's some variation, but overall it's fairly close to the fit line. According to that fit, we have τ = 4, meaning the number of cases increases by e every 4 days. To put that in more relatable terms, that's doubling the cases every 2.8 days!

Looking at the US cases compared to the global total,
we can see that the global rate is beginning to taper off compared to the US, suggesting we should do more to limit the spread!

Tuesday, November 19, 2019

Cents and Cents-Ability

A late post this week, since I'm currently traveling in Italy with my parents! Going between EU countries and using cash more often than usual has reminded me of how inept I feel making change in euros after 30 years of using the US denominations. I thought I'd take a look at the relationship between the different coin/bill values and the ways to get a certain amount of money.

Here are the US denominations less than $5 (not including $1):
Wikipedia
And the EU denominations less than 5€:
Wikipedia

We're looking for ways to get a total value using some number of each of these coins. We can write this as an equation, for example
where p, n, d, q, and D are the numbers of pennies, nickels, dimes, quarters, and dollars. Since we no longer cut coins to make change, all these values must be integers, which makes this a Diophantine equation. These can be difficult to solve; the Python package SymPy has tools for it, but I couldn't find a way to restrict it to only positive integers (handling anti-pennies is far too dangerous). I was able to make my own though, which uses a simple brute-force technique.

Since it slows down exponentially as the total value gets larger, I was only able to run it for values up to 4 dollars/euros. The results are still interesting though. Here's the minimum number of coins needed to make a total:

As each larger denomination becomes available, there's a sudden drop in the number of coins needed. Since euros include many more denominations, they're able to use fewer.

We won't always get the minimum in change though, so it's useful to look at the different ways to make a value, and find out what the average number of coins is:
These are going to include many sets with mostly pennies though, so we can also look at the median:
At the very beginning of each of these, you can see there are a few cases where the US uses more coins, probably due to the euro having a 2 cent coin, but in the end, more denominations means more coins on average.

There are many things I'll need to unlearn when I return to the US next month (like saying "merci" instead of "thanks"), but since I never really got the hang of euros I suppose making change won't be one of them.