Pages

Showing posts with label Classical Mechanics. Show all posts

Wednesday, February 26, 2025

Teach Your Physicist to Suck Eggs

Recently I was reminded of a neat science demo where burning a match inside a bottle can suck in a boiled egg that otherwise wouldn't fit:

I saw similar demos growing up, and I believe I was given the incorrect explanation of the match using up the oxygen to lower the pressure. As the video above points out, it's actually the heat from the fire that makes the air expand and escape from the bottle. After the air cools, the pressure is lower and the atmosphere pushes the egg into the bottle. I was curious whether I could determine the pressures involved in this demo.

Burning the match releases heat, which raises the temperature of the air in the bottle. According to the Energy Information Administration, burning a match releases 1 BTU of energy. Using air's heat capacity, density, and a volume of 1 L, we can calculate that this will raise the temperature by an impressive 1220 K. We can use the ideal gas law to see what that does to the air:

Increasing the temperature, T, will cause the pressure, P, to to go up. This pushes up on the egg allowing some air to escape. If we suppose that the pressure required is very small, we can instead assume all the energy from heating the air goes into expanding the volume, V. We could use this to find the final volume of the air, and thus how much escapes from the bottle, but we don't really care about the air that escapes. Instead, we can just suppose our 1 L bottle of air at a room temperature of 300 K is now at its new temperature of 1520 K, with the pressure remaining constant.

Now we can flip the relation, and suppose the volume and number of particles, N, stays constant. We can write

where the subscripts specify the initial and final states. Using the temperature we calculated and 1 atm of pressure, returning to room temperature would bring the pressure to approximately 0.25 atm. That implies the atmosphere is pushing down with 0.75 atm of net pressure. We can get the area of the egg's cross-section and multiply by the pressure for a force of 110 N, or about 25 lbs. Not enormous, but it's easy to see how applying that force unevenly by pushing with your fingers would just mush the egg.

Turning to the latter part of the video, how about getting the egg out again? The maximum pressure a person can blow is about 0.1 atm, 40% of the pressure that pushed it in. If you watch the video above though, you can see the egg goes into the bottle with a great deal of speed, while getting it out isn't nearly as violent, so these results appear to be consistent. Cool experiment to try if you've never seen it before!

Sunday, December 22, 2024

Sync or Swim

Recently I was reminded of this demo of coupled oscillators, using metronomes on a moving platform:

Even though the metronomes are set to different frequencies and start at different points, by connecting their motion through the table, they come into sync automatically. I was curious if I could make a simple simulator that would exhibit the same effect. Each metronome has a number of torques acting to make the bob swing back and forth: there's gravity pulling down on the bob, a spring pulling the bob upright, a drag force that depends on the velocity, and an external force from the platform. In many ways this resembles the resonant pendulum I posted so long ago, but the coupling from having many oscillators makes things interesting. We can write the torque on each metronome as

The force from the platform is the sum of all the metronomes, since swinging the bob around applies a reaction force at the base of the metronome. I set up this simulation and threw in a bunch of numbers for the various parameters. After a bit of tweaking, I got something that looked pretty good:

This gets reasonably good looking by the end, but still a little out of sync. If we run it for even longer, we can look at the error between the angle of each metronome and the average angle:

It takes about 100,000 steps for them to get into a good synchronization – Not quite like the video above, but another fun toy to play with!

Sunday, October 6, 2024

Touched By His Noodly Appendage

[Click here if you've yet to welcome the Flying Spaghetti Monster into your heart and stomach!]

Near out house, there a several car dealerships, which have the requisite flailing noodle men out front:


via GIPHY

I was curious whether I could make a simple model of this system that still showed the interesting dynamics. The way I imagined it was a series of joints stacked on top of each other with fixed length, but able to bend left or right. Gravity will bend each joint according to the distribution of mass above it, and the puffs of air will straighten each joint as it passes through.

Since I'm using only 20 nodes, at first I tried to make the pressure changes move between them smoothly, but I couldn't find a good way to do that without adding a bunch more complexity to the simulation, so instead I just had the pressure move to the next node on each step. The air comes in periodic bursts, which I modeled as a square wave, which turns on and off at some frequency. When I tried this model, I got a bit too much flailing, and my noodle person was spinning crazily around the anchor point, so I realized I needed drag.

There are two typical models for drag, both proportional to the object's velocity, but one linear and the other quadratic. I tried the linear case initially, but that wasn't strong enough, so I switched to the quadratic. I makes sense that we would be in the high-drag case, since this is flimsy plastic sheeting pushing against air.

If you'd like to make plans before opening your own dealership, you can find my code here, or you can sit back and watch some joyous flailing from your own home:

Sunday, June 30, 2024

Angle of the Dangle

Since last year, Steve has been confined to a wheelchair. He gets in and out of it with help from a device called a Hoyer Lift:

Hillrom

The straps at the head and legs have several different notches to adjust the length from the hoist attachments. Along with those adjustments, Steve can also lie higher or lower in the sling, and adjust the angle between his legs and torso. Given these options then, Sally asks: How do we adjust things to get Steve to be more/less upright?

This turns out to be a surprisingly complicated geometry problem. I started off by diagramming it this way:

a and b are the lengths of the two straps, L is Steve's height, h is how far down the pad he's positioned, and θ is the leg-torso angle. We can use the Law of Cosines to first find the width of the two triangles, w, and then the angle between the lift straps:

What we need to figure out from here is the coordinates of that lowest point, where the sling bends. To do that, I rotated the setup so that a lay on the x-axis, and worked out the geometry from there. If the point we want is at (x,y) in these coordinates, then we can write

Solving these 4 equations together produces pages of messy equations, so instead I decided to do it numerically. Since my goal was to make an interactive tool my parents could use, I'm working in JavaScript, so I had to make my own equation solver. I decided to use the bisection method, in which we find the point where a function crosses zero by bracketing it more and more finely. For some combinations of parameters the algorithm fails to find a solution, and the angles don't always look right, but I think it can give a feel for how these different choices factor into the final angle that the lift rests. You can see the code here, or just play with it below!

Saturday, April 6, 2024

Round Wave in a Square Hole

The little camper we've been living in for the past 6 months (!) has a shower in its bathroom, but the bathroom's size and design is similar to those you find on an airplane, so adding a shower doesn't leave much room for a person. Instead, I typically take showers in the campground's bath house, but that comes with its own quirks. Often the drains won't keep up with the shower's water input, and I'll get a standing pool in the stall. What caught my attention recently was the waves I made as I moved around, which bounced off the walls and recombined, creating interesting patterns. I realized I could adapt the simulation I originally made for waves on the ball drum to two dimensions and do some experimenting! Easier said than done it turned out, and it took me a bit to get things working properly, but I'm quite pleased with the result.

The key to the dynamics is an operator called the Laplacian, which measures the curvature around a point on an N-dimensional surface. For a 2D grid, we can calculate it as

In our case, f represents the height of the water at a given point, and h is the size of our grid points. This gives us the force on the water, so we integrate twice to get the new heights. When h would hit one of the walls, we use a similar tactic to my Roomba post, and use a mirror image of the wave. That gives us the interesting dynamics I was looking for.

Below you'll find my simulation of the waves – click or click-and-drag to disturb the water. There's no damping, but (since energy is conserved) the waves get weaker as they spread out, so you may need to draw more than a single point to see reflections from the walls. You might notice it's a bit pixelated – The integration is not very efficient, so to speed things up it's simulated on a small grid and scaled up. This was actually the cause of the delay in finishing, since it took me a couple tries to get the scaling to work. You can hit the reset button to clear your waves and go back to a calm blue ocean/public shower stall. Have fun!

Saturday, February 24, 2024

A* is Born

I've mentioned before that I never learned to drive, but recently Marika and I have been discussing finally getting my license. I've always found the mechanics of parallel parking perplexing, and I wondered if I could make it clearer to myself with a simulation. Initially, I tried to work out a full kinematic model: Each tire is applying a force and torque on the car's center of mass, causing the car to move and turn. I couldn't get that to work properly though, instead ending up with the car skidding sideways crazily. I realized instead I could ensure the wheels stayed in line by looking at the perspective of the rear axel. During a turn, these wheels stay pointing straight, but can spin at different rates. We can therefore represent the motion of the car as a combination of forward (or back) and rotating around the back tires. I implemented this in Python, then as a test had it drive forward steering 45° to the left:

So now we have a representation of our car, but how can we get it to parallel park? I tried a couple series of commands based on my second-hand parking experience, but I still couldn't get the car to do what I wanted. Then I started thinking about the recent developments in self-driving technology, and decided to try finding the solution algorithmically. After reading a bit about different path-finding techniques, I chose A*, which tries to find a path that gets closest to the target, using the fewest steps. Wikipedia has a nice animation of an example search:

Wikipedia

The technique works by keeping a list of open points (blue), which can spawn new open points by trying all possible moves from a given point. Once all the new moves are generated, we move that point to the closed list (red). We keep the list of open points sorted according to how many steps we are from the start and an estimate of the distance to the target. That way, we can generate our new points from the best point so far – You can see that effect above when the search gets around the wall.

To limit the number of choices to feed into this technique, I chose to give steering options of 0°, 45° left, and 45° right, while driving forward or backward a fixed amount. Given that I didn't spend much time optimizing my code, I was surprised at how quickly it was able to get close to the target. The animation below shows the current best point in blue at each step of the search, with the target in red:

Looking at the distance each of those "best points" lands from the target shows the advantage of the A* search:

A* allows the car to get further from its goal temporarily, resulting in a better final position. This all looks very promising, so let's see that robo-chauffeur in action!

I'm getting some "nervous student-driver" vibes from this, but overall not bad. I think I may be better off with my mushy brain for now, but it's only a matter of time.

Sunday, January 28, 2024

Chain Change

Recently I've been rereading the book Seveneves by Neal Stephenson, which opens with the Moon being destroyed by an unknown object, forcing humanity to flee the surface of the Earth before the debris comes through the atmosphere. One of the engineers that goes into space notices something interesting about the chain he wears:

[He] had got it spinning around his neck. It had opened up into a broad, undulating oval that didn't touch his neck or collar anywhere, so it was just orbiting around him in free space. [...] He had learned a few tricks for speeding it up and coaxing it into different shapes by blowing on it with a drinking straw or flicking it with a fingernail. [...He] poked an index finger up into the chain's path. It caught on his knuckle, hiccupped, and suddenly wrapped around his hand in a chaotic tangle.

I was really curious if I could simulate some of these effects, so I came up with a simple model for the chain: A circle of points that are connected to each other by simple springs. The force applied by the springs is proportional to how far each point is from its neighbors, so the circle will tend to collapse to a point, but if we set it spinning, then just like an orbit we can keep the points from falling inward. We can see what happens if we tap one of the nodes:

This shows some really nifty behavior: Part of the poke moves around the circle in the direction of rotation, but there's also a dent that stays fairly stable until the other part of the poke comes around again. You might also notice when the animation loops that the chain has moved off-center by a fair amount. That made me wonder what would happen if I poked it symmetrically on each side:

Now the chain stays centered, but becomes more ellipsoidal, with the long axis rotating with the nodes. So far, so good – Let's try sticking a finger in it!

Hmm, not quite what we were looking for. To model the "finger," I checked at every step whether each node was inside the finger's radius. If it was, I would move it to the nearest point outside. Unfortunately, this meant that if I moved the finger much further in than I do above, links would start popping to the outside, which sounds painful for our simulacrum! I do like the faux-3D helix the chain forms on the other side of the finger though. 

Sunday, January 14, 2024

Fraught Freight

Now that I'm actually going into an office every day, I'm once again a car commuter, and I'm filled with transportation-related questions! Our route mostly involves the highway, and I was curious about the rollover signs on off-ramps:

rxrsignals.com

This shows a truck tilting at a 30° angle, while going 25 mph. The tilt comes from the fact that the truck is going around a curve, which requires applying a centripetal force. Since this force is applied to the tires, there's a torque produced, which will act to tip the truck toward the outside of the curve:

The red dot marks the truck's center of mass, with m the total mass of the truck, and a the acceleration required to make the turn. This is given by

where R is the radius of the turn. To find this, we can use Google Maps' measuring tool on the ramp by our home:

Given this R, along with the speed and dimensions of the truck, we can find the height of the center of mass that would produce the given tilt – The diagram above is too high, and the truck would tip over, but to balance g and a, we would need

where θ is the tilt angle. Using our 30° case, and the turn shown above, we can check the heights for several different speeds:

In most cases, we should expect the truck to be loaded such that the center of mass is in the center of the truck, which means the posted limit for our turn of 25 mph is just about right!

Sunday, December 17, 2023

Pneumatic Drop

Now that we're in Florida, and no longer sheltering from COVID, I've actually been working on campus. My department is in the (slow) process of moving to a new building, so I've been temporarily put in one of the large offices shared by grad students, and I've noticed an interesting quirk of my chair: After I get up, now and then it will sink to its lowest height, so I need to raise it again when I sit down. I was curious what was going on, and decided to look into how the lift mechanism works (or doesn't).

Most office chairs use a pneumatic cylinder to set and maintain a given height. They consist of a tube that can let air in or out when you open a valve, a piston connected to the chair, and a spring linking the tube to the piston:

We've defined a few variables here: L is the uncompressed length of the spring, i.e. the maximum height of the seat, hset is the height the chair is set to when the valve is closed, and h is the rest height. Using these, we can write the 3 forces acting on the seat:

where patm is the atmospheric pressure, A is the cross-section of the cylinder, k is the spring constant, m is the mass of the person on the chair, and g is the acceleration from gravity. If we set F = 0, we can get the rest state of the chair, and try a few values for the various quantities:

Here we've solved the above equation for h, and then plugged in a bunch of values for m and hset. I chose L to be 15 cm, A to be for a diameter of 5 cm, and set k so that 40 kg can compress the spring by L. The black lines show some constant values for the rest height, which gradually change slope depending on the set height. I decided to replot these points to better show the relationship between the set height and the rest height:

The dashed line shows points where the chair does not move from its set height – I was surprised to see so many points above the line, meaning the chair rises from its set point, but I'm thinking that's due to the spring strength I used, which may be way off.

As interesting as this was to work though, it doesn't bring me any closer to explaining why my chair drops while I'm not sitting on it, rather than rises. Time to write a grant proposal for "Pneumatic Posterior Support System Instabilities: Sources & Solutions"!

Sunday, September 24, 2023

Losing My Marbles

Next week, Marika and I will be flying to Massachusetts to visit my parents, and receive the generous gift of their camper van! Our trip happens to overlap which a favorite event on my childhood, the Ashfield Fall Festival. It includes local art, music, and cooking, but I was always more interested in the games. There was the usual tipping ladder, but my game of choice was the marble rolls. These were made from boards tipped at an angle with a grid of nails pounded into them. Rubber bands were stretched between nails in a pattern so that a marble dropped from the top would bounce off the nails and bands until it landed in one of the slots at the bottom. Different slots were worth different points that would determine your prize. I've now been studying physics for half my life, so I thought I could look at the game not as lottery, but as a deterministic physical system, and maybe win myself some grand-prize trinkets on this trip!

As the marble rolls down, it hits nails and bands that change its direction. Physicists typically look at collisions from two extremes: elastic and inelastic collisions. In both cases, momentum is conserved. For elastic collisions, energy is also conserved, but inelastic collisions in which the objects "hit and stick," or finish with the same velocity, lose the most energy possible while maintaining momentum conservation. For collisions between our marble and the nails/bands, the velocity we care about is only in the direction connecting the two objects: both collisions will stop the marble from going through it, but keep the component of velocity perpendicular the same. For nails we'll use inelastic collisions, which simply stop any motion through the nail, and for rubber bands we'll use elastic collisions, which reverse the direction.

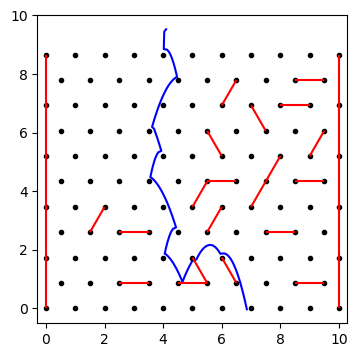
I wrote some Python code to simulate this, randomly choosing pairs of adjacent nails to stretch bands between. Checking when the marble hits a nail is pretty simple, since we can just get the distance between the points and see if it's within the radius of the marble. The bands are a bit more involved: we have a line segment between two points, and need to know the distance to a third point. The closest point on the line segment will be on the perpendicular that passes through the marble's center (proof left as an exercise for the reader, heh). I ran into a couple edge effects in the simulation, where the marble would get sort of "hooked" on one of the nails, but overall I'm pleased with the results:

Now that we have this basic framework, we can generate a board, then map out the landing positions for all the different starting points. I decided to make a sort of flip-book with different numbers of bands, randomly chosen. The starting positions are shown by different colored lines, and the bottom of the plot shows a histogram of where the marbles land.

I couldn't figure out a good way to get statistical measures, but it's interesting to see the gaps just below bands where no marbles pass through, and to see cases where a marble starting on one side of the board crosses to the other side. The 0-band case has a nice symmetry to it, and some of the middle ones look a bit like Jackson Pollock paintings, but the important part is, with this on my side, that plastic lobster harmonica is mine!

Sunday, July 23, 2023

Oscillibations

A common question that arises for over-caffeinated physicists is, why does carrying a mug of coffee make it slosh over the rim? Ever since Marika got us our Apple Watches, I've been wanting to use the accelerometers in the watch, which allow it to measure your arm's orientation and motion, to record how my hand moves when walking with a mug. Sadly, I couldn't find an app that would allow me to download the data... until now! I recently decided to have another look, and found HemiPhysioData, designed to help people recovering from injuries track their progress regaining movement.

Accelerometers are a type of sensor that measure acceleration in a particular direction. A simple example is a weight on a scale: This measures a force, which is a mass multiplied by an acceleration. Typically these are used with just the acceleration due to gravity, but if you lift or lower a scale suddenly, you can increase or decrease the acceleration it reads. Inside the watch is a 3-axis accelerometer, which measures the acceleration through the face, top, and side of the watch. Using these measurements, it estimates a direction for gravity, since 9.8 m/s^2 is (hopefully) much more than an average person experiences otherwise. Subtracting that from the total acceleration gives just the wearer's contribution from moving around. We can also use it to find the orientation of the watch. All these measurements are spit out by the app as columns of a file:

  1. ID columns, giving info about the run
  2. Timestamp, measured at 100 Hz
  3. Roll/Pitch/Yaw Euler rotations
  4. Rotation vector x/y/z
  5. Estimated gravity x/y/z
  6. User acceleration x/y/z (total accel. minus gravity)
  7. Quaternion rotation w/x/y/z
  8. Raw acceleration x/y/z
The Euler, vector, and quaternion rotations are all methods for expressing the orientation of the watch. We can use these to rotate the user acceleration into the wearer's reference frame, rather than the watch's frame.

I decided to try comparing two runs: carrying an empty mug with a normal walking pace, and carrying a full mug being careful not to spill. Here's the output of the sensors for those two runs:

There's a clear periodicity to both datasets, but the differences between the two aren't clear. Instead of looking at the time-domain, we can look at the frequency spectra:

Now we can see that the empty mug has a few spikes between 4-7 Hz. If you look at Figure 5b in the paper I linked at the top, you can see this is the upper end of the frequencies that most excited the liquid in their mug. The paper points out that changing the radius of the mug will shift the resonance frequency, so the difference could be explained by the size of the mug.

The paper suggests a few methods for decreasing the risk of spilling, including dividing the cup into many small tubes, adding foam, or using a "claw grip", but I'll leave you with their comments on the suggestion of walking backwards to prevent spillage:

Of course, walking backwards may be less of a practical method to prevent coffee spilling than a mere physical speculation. A few trials will soon reveal that walking backwards, much more than suppressing resonance, drastically increases the chances of tripping on a stone or crashing into a passing by colleague who may also be walking backwards (this would most definitely lead to spillage).

Monday, July 10, 2023

Bottle Throttle

Last week I got a question from my nephew Ezra: How does the bottle-flipping trick work? What's the best amount of water to use?

In case you're unfamiliar with the phenomenon, Ezra sent along a demo of one of his flips:

As a first approximation, I figured the water should stay fairly stable in the bottom of the bottle, and the main factor that dictates whether it lands upright is how much water is in it, and the range of impact angles that cause it to tip onto its base. I pictured the landing like this:

What matters here is the height of the center of mass, which we can calculate with

where mb and mw are the masses of the bottle and the water. The tipping point will be when the center of mass is over the contact point: Farther left, and it will fall on its side, farther right and it will stay upright. The maximum value of θ then is

We can plot this for different water levels to find the best height of water (assuming a 500 ml bottle, per this page):

This model gives the optimum water level as 12%, but I wasn't entirely confident in my simplified model. I wondered whether anyone had looked at this problem in detail, and lo and behold, an arXiv paper called Water Bottle Flipping Physics!

The paper looked at 3 cases: a rigid bottle, similar to the model I came up with; a can with a pair of tennis balls, which is a simpler model with mass moving around inside; and finally the water bottle:

Figure 3

The key finding in the paper was that the bottle's rotational momentum gets absorbed by the water. This happens in such a way that the bottle stops rotating with its base pointing down. In my model above, I didn't consider an existing rotational velocity on landing, which could easily tip the bottle. According to the paper, for the water bottle the ideal filling fraction is

where M is the ratio of the mass of water in a full bottle to the mass of the bottle itself. For the numbers I used, I get M = 56 and f = 12% again! It seems at least for the 500 ml bottle, the approximation works great, but for other sizes they'll diverge.

Saturday, June 24, 2023

Hail! Hail! To Michigan!

[Title from the University of Michigan fight song, which Steve couldn't stop singing when I was accepted to the graduate program.]

A couple of weeks ago, we had a sudden hailstorm while I was cooking dinner, and the kitchen skylight made some incredible (and alarming) sounds:

I started to wonder whether I was in danger of being showered with glass, and while the skylight (and I) survived the storm, I thought I'd take a look at what the chances were for future shattering.

Hailstones can form in tall thunderclouds with lots of air movement, where water drops can rise into cooler regions and freeze, then fall partway to collect more water. This repeats several times before the hail falls. If it falls far enough, it will reach terminal velocity, the speed at which the force from gravity pulling down balances the air resistance slowing it down:

where m is the mass, g the gravitational acceleration, ρ is the density of air, A is the cross-sectional area of the hailstone, and Cd the drag coefficient, which depends on the shape of the object. Since I'm a physicist, I'll assume the stones are spheres with uniform density. Then we can express the mass and area in terms of the radius of the hailstone, and use the tabulated value for the drag coefficient:

Plugging these into the velocity equation above, we find

I wanted to check whether this was reasonable, so I found a paper from the University of Wyoming with this plot:

Figure 1

If we plot our function over the same range of diameters, the velocities match incredibly well, given the simplifying assumptions we made:

Now that the velocity is settled, we can look at how much energy the hailstones carry. Kinetic energy uses both the velocity and mass to give

So now the question becomes, at what point is this large enough to break glass? Lucky for us, a student at the CUNY College of Criminal Justice wrote their thesis on shooting BBs at windows!

Table 2

This gives the minimum energy for damage as around 2 kJ. We can plot energy vs hail size and see how big the stones have to get:

According to this, the glass will start to be damaged at a diameter of about 140 mm, or the size of a softball! At that point, I think there may be more to worry about than just the skylight.

Sunday, June 18, 2023

Scanning the Skies

Last week, the LIGO-Virgo-Kagra Collaboration held a town hall with electromagnetic observers to discuss the status of the ongoing 4th observing run. Among the presenters were representatives of the Swift Burst Alert Telescope, or BAT, a satellite designed to detect gamma rays like the ones released by the binary neutron star collision LIGO picked up in 2017. They caught my attention with the name for their analysis tool for BAT: GUANO, and I'm a sucker for Dr. Strangelove references. What I started thinking about though, was what would be the best strategy for observing the whole sky, given that the satellite can only make detections in a small patch at any given time.

The theory is to use the same type of effect I discussed several years ago, where a spinning object tumbles in unexpected ways, thanks to Euler's equation:

According to this, if the angular velocity ω is not aligned with the symmetries of the object, represented by I, the velocity will change, even if the torque τ is zero. While it bears little resemblance to BAT, I decided to see what happens if I take a simple cylinder, and spin it off-axis. The plot below shows the cylinder in 3D, with a line marking a constant point on the outside to show rolling motion (though a plotting quirk makes it hard to see sometimes). Under that is a skymap of the parts of the sky the telescope has passed over.

You can see the color rescales to account for the telescope retracing areas it's seen before. I wondered though whether I could pick a particular rotational velocity that would allow the telescope to scan the whole sky without ever needing to apply a torque, which would require fuel. After failing to get an optimizer to figure out the best choice, I just tried a bunch of values, and settled on this one, which makes a nice latticework:

Of course, you can imagine the nauseating sort of view this pattern will give you! If this were actually the way the satellite operated, it would need a lot of post-processing, but the whole point of LIGO's public alerts is that detectors like this one can rapidly refocus on possible events, so I don't expect Swift to adopt this technique anytime soon.