Pages

Showing posts with label Medicine. Show all posts

Saturday, March 8, 2025

Concerning Contagion

A measles outbreak has been in the news lately, and since the disease was previously considered eradicated in the US, I wanted to try a simple model of disease spread with and without vaccination. To represent a population, I used Python's NetworkX package, which gives us nodes (people) connected by edges (contact that can spread disease). In addition to vaccination status, I wanted to see how different levels of contact affected spread, so I generated the layouts using the Watts-Strogatz Graph, which takes a given number of nodes n, a community size k, and a rewiring parameter pwire. The nodes are arranged in a ring, with each connected to its k nearest neighbors. Then we randomly switch some of those connections according to pwire to randomize the interactions a bit.

Turning now to the nodes of these networks, the model for people I chose tracked a few qualities: Current infection, vaccination/immunity status, susceptibility to infection, and infectious period. Based on some stats I found from the CDC, I decided after being infected a person would be sick for 22 days, but only contagious for days 10-18. While contagious, each day a person's neighbors can become infected according to their susceptibility (0.5% for immune, 50% otherwise). I started the model with 10% of people infected, and ran until all cases were gone or a maximum of 300 steps (days). I ran several different values for k and pwire, as well as different vaccination levels.

After running the simulations, I tried to come up with some summary statistics. The first thing that came to mind was the fraction of people that get sick:

The x-axis shows the k parameter for each run, which represents the number of people each person has contact with. For the lower values of k, this shows clear separation in the different levels of vaccination – Low vaccination leads to high infection rates. With enough connection though, everyone encounters an unvaccinated person and gets sick.

That's just the number of people who ever get sick, but we can also look at how long the disease spreads before being eradicated:

Again we see a big uptick for high community size, to the point where disease is still spreading after 300 steps. For the smallest size, we again see separation in the vaccination rates, but there's also an effect from the pwire parameter. This is easier to understand if we look at a map of one of these communities:

Blue dots are people who have never been ill, red are currently sick, and green are vaccinated, or recovered. The twisting shape shows how the pwire parameter has connected a few people on opposite sides of the initial ring. The black dot in the plot above shows that for low pwire, the disease has to make its way around the whole ring, increasing the time to eradication. We can also look at a case with larger communities and more interconnection:

In this case, almost everyone immediately gets sick, which you might imagine would reduce the time before the disease is eradicated, but the increased connection also results in many more breakthrough infections.

I'm really impressed with the complex behavior this simple model was able to show! That said, I fully recognize it's just a toy, and should not be used for setting policy. I'm not headed to that farm upstate just yet...

Saturday, January 23, 2021

Searching in Vein

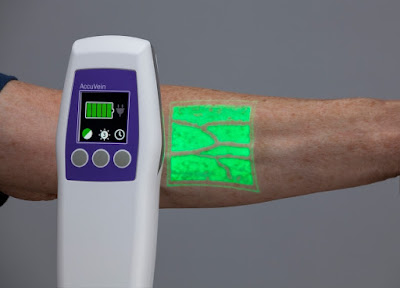
Earlier this week, I had one of my periodic MRIs as a cancer survivor – All clear! During the scan, I get a chemical injected partway through called gadolinium, which allows the scanner to pick up blood flow. Since chemotherapy, my veins have been more constricted than most people's, making it difficult to get the IV in. After a couple failed attempts to get a vein by feel, the tech got out a type of vein-finding device I had never seen before:

AccuVein

This is a little different from the one that was used on me, but the tech was already flustered enough from the two failed pokes without me pulling a camera out. The device projects a square of light with shadows anywhere there's a vein. As was the case when I got an ultrasound, I started asking questions about how it works, only to be met with shrugs.

It turns out the device uses near-infrared light to scan over the area. Blood vessels contain lots of water, which absorbs in the near-infrared region:

Wikipedia

This plot shows the amount of light absorbed by liquid water at different wavelengths. It dips down for the visible spectrum, which is why water appears transparent, but rises quickly on either side. That means the blood vessels will absorb the light put out by the device, instead of reflecting it. It can detect where these gaps in reflection occur, and project an image of the veins on skin.

I've been a cancer patient and survivor for 10 years now, and I'm delighted to keep finding interesting physics in my medical experiences!

Saturday, June 6, 2020

Remote Medicine

I missed posting last week, since we were busy driving to our new home of Gainesville, FL! I have a new postdoc with the university, which I'll talk about in a later post. This week though I wanted something a bit shorter, since we've got several rental viewings to go to. I thought I'd try to expand on something I wrote on Facebook a few months ago, at the start of the lockdowns.

My friend Seth wrote that he didn't have a thermometer on hand, and most stores were sold out. I offered this suggestion:
Here's an idea I just had that could work in theory: If you have a TV remote and a voltmeter, you could press the remote against your head, and measure the voltage across the LED, which will be proportional to the infrared light emitted by your skin, which in turn is proportional to your temperature. Physicist Survival Skills!
I've mentioned TV remotes before, but this idea doesn't use the IR LED in the typical way. While LEDs are designed to emit light (as the name implies), they can also generate voltage when they absorb light near their own wavelength. You can see a demonstration of both uses in this video:

The question is how to calibrate the "thermometer" so we can convert between voltage and temperature. We need some known temperatures we can sample. Two possibilities I thought of were boiling water, and (assuming you haven't fully switched to fluorescents) incandescent light bulbs. Depending on your elevation, water will boil around 373.15 Kelvin, and bulbs emit light according to the blackbody distribution at 2400 K. That means your temperature (in Kelvin) will be

As usual though, ramblings from a crazy physicist are no substitute for healthcare, so I do not endorse the use of improvised TV thermometers. Thanks for a great idea, Seth, and stay healthy everyone!

Saturday, March 28, 2020

Exponential Exposé

With Michigan and most other places in the world sheltering from COVID-19, I thought it might be interesting to talk about exponential growth, and how it relates to disease spread. Disease is transferred from one person to others, so the number of new people who get a disease is related to the number who have it now. We can write that as a differential equation:
N is the number of people with the virus, and the dot indicates the change in time. τ is a time constant that tells how quickly the disease spreads. Solving this equation gives
At t = 0, we have one case, and after every τ, the number increases by a factor of e (= 2.71828).

A couple days ago, the blog Hack-a-Day (which I've mentioned before) had a post about getting realtime data about COVID-19 statistics. I wrote up a Python script to pull the data we're interested in, and make some plots. First, we can look at the total number of US cases over time:
According to the equations above, if we look at the increase from day to day, it should be linearly related to the number of cases on that day. Plotting gives
There's some variation, but overall it's fairly close to the fit line. According to that fit, we have τ = 4, meaning the number of cases increases by e every 4 days. To put that in more relatable terms, that's doubling the cases every 2.8 days!

Looking at the US cases compared to the global total,
we can see that the global rate is beginning to taper off compared to the US, suggesting we should do more to limit the spread!

Sunday, December 23, 2018

Zap!

Happy Diagnosis Day! It's been 8 years since that fateful day when doctors discovered a 3 cm mass perched on my pineal gland. In that time, I graduated from college, went off to graduate school, married an amazing woman, got my PhD, and moved to France for a post-doc! In honor of the occasion, today I wanted to discuss radiation.

Part of my treatment included proton radiation, which I've talked about before (long before). While that exposure was medicinal, it's still best to limit overall radiation exposure to skin to about 50 millisievert (mSv) per year. For a couple years after my treatment, I avoided the TSA body scanners, opting for the manual screening. However, during a recent visit (to Michigan, not France) my friend Kevin wondered, How much radiation exposure do you get from flying in the upper atmosphere, compared to the security scans?

It turns out the TSA has actually used two different types of scanner in airports: x-ray backscatter, and millimeter wave. Up until 2012, the TSA mainly used x-ray backscatter machines, but switched to millimeter wave after manufacturer disputes. The EU actually banned x-ray backscatter in 2011 due to health risks.

Normal x-ray machines work by measuring the fraction of x-rays that pass through a material. Denser substances, like bone, absorb more of the x-rays and appear as white areas on the resulting photographic negative. Backscatter machines instead measure the rays that are reflected from an object, giving an image of the outer surfaces. The trouble with this is, x-rays are a form of ionizing radiation:
By Spazturtle - Own work, CC BY-SA 4.0, Link
Ionizing radiation means that it carries enough energy to damage cells, potentially resulting in cancer. This is why (in the EU anyway) these machines are no longer in use.

The alternative full-body scanning device is the millimeter-wave scanner, which use waves with a frequency of

On the chart above, this is just below the visible range, well into the non-ionizing region. Like the x-ray backscatter, these machines form an image by bouncing the waves off your body, and interpreting the reflected signal.

So, on to the exposure issue: The point Kevin brought up is that our sun puts out damaging ultraviolet light, and there are even more powerful cosmic rays coming from elsewhere in the universe. Typically, the Earth's atmosphere protects us from those sources, but by going high in the air, we strip away some of those protections.

The American Association of Physicists in Medicine released a report in 2013 comparing the exposure levels for a person of my size (5'10" and 160 lbs) on the ground, in the air, and in a scanner. The way they present their results though is a bit confusing (2.84 hour flight?). Instead, let's do some unit conversions to find how long, on the ground and in the air, it takes to equal the 11.1 nanosieverts they measured from an x-ray backscatter machine (which, remember, is no longer in use). On the ground, a person my size gets about 3.11 millisieverts per year, which means it takes 113 seconds to equal one scan. In the air, it's even less than that, 12.1 seconds!

There are lots of other issues with airport scanning machines, including privacy, and other possible health risks associated with radiation exposure. From the perspective of standard exposure limits though, you're a lot better off staying in the machine than going in the plane!

Friday, June 10, 2011

Beam Shaping 101

On our way to the proton center today, I got a call saying the machine was having problems, and my treatment would be delayed.  It only ended up being about an hour and a half later than expected, but they made up for it by taking me to the beam control room to meet two of the physicists who run things.  I got to hear all about how the beam is shaped before it arrives at my brain.

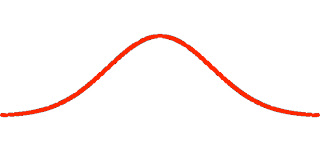
As is typical with cyclotrons, the beam initially has a Gaussian shape, which looks like this:
where the height represents the number of protons in that part of the beam.  We'd really prefer a uniform beam, since this will be easier to shape into the particular distribution we want, conforming to the tumor being treated.  To do this, they send the beam through a lead lens, to get a beam that looks like this:
where the color indicates the speed of the protons, blue being the slowest.  This still isn't ideal, since we no longer have uniform velocity, so the beam is also sent through a plastic lens, which slows the protons without spreading them out:
Now we have a beam that's uniform both in velocity and in density, ready to be sent into my head.

Thursday, June 9, 2011

Ripping the Air a New One

I've finished two days of my proton therapy, and I'm feeling fine so far, but the driving and treatment take up a lot of my day, so I might not manage a real post until this weekend.  This is just a quick post to point out two interesting side-effects of the treatment.  While the beam is directed at my head (as opposed to spine) I can see white spots with my eyes closed, and smell a strange odor.  I asked one of the technicians about this today, and she told me that both are due to the protons interacting with parts of my head.  I didn't get any details on the light – just some reaction with the optical parts of the brain – but the smell is caused by the protons ionizing the air in my sinuses.  Coincidentally, we're currently having a thunderstorm here, which also involves ionizing air, in the form of lightning.  Pretty cool (and admittedly terrifying) stuff...

Tuesday, June 7, 2011

12 Stories High, Made of Radiation


Tomorrow, Steve and I start our daily trips into Boston for my proton therapy treatment.  The doctors have warned me that it can leave me pretty fatigued, so I'm not sure yet if I'll be up for doing more posts.  I have one almost finished about the shower in our new condo, but it's run into some complications I haven't worked out yet.

I'm going to try to stay active here over the next 6 weeks of the treatment, but I make no promises.  In any case, thanks again to everyone who's been reading.  Feel free to leave suggestions/questions for future posts in the comments.

Friday, June 3, 2011

It's Not Just for Babies

Yesterday, my feet were a bit swollen and painful, so my oncology doctor advised me to go to the local hospital to make sure it wasn't a blood clot.  After sitting there for 5 hours through blood tests and an ultrasound, they decided it wasn't a clot, but weren't sure what it was.  Things seem much better this morning, but just so the trip wasn't a total loss, I figured I'd talk a bit about how ultrasound works, since it was a pretty cool part of the experience.

As the name implies, ultrasound uses high-frequency sound waves to look inside your body.  The waves reflect off the various internal structures and return to the sensor.  By measuring the strength of the echo compared to the original wave, we can estimate how dense the reflecting structure is.  By timing the echo, we can also determine how deep the structure is.

One of the advantages of ultrasound over other imaging techniques, like CT scans or MRIs, is that it can directly measure the movement of blood (hence its usefulness in finding clots).  This is done by measuring the Doppler shift of the reflected wave.  Since we know what frequency we're emitting, we can measure the echo's frequency for comparison.  If it's higher, we know the wave reflected off something moving toward the sensor, while if the frequency is lower, we're detecting something moving away.  While scanning my legs, the technician would occasionally ask me to flex my foot, increasing the blood flow.  This would cause a spike in the signal from my blood vessels, and served as evidence that I was clot-free.

Here's a picture of a typical ultrasound image (from Wikipedia):
The red indicates a red-shift (movement away), while the shading indicates density.

I mentioned to my technician that I write a physics blog, and this would probably be a post, and he responded that 90% of ultrasound techs (including him) forget all the physics they had to learn immediately after taking their test.  Clearly it's not vital knowledge, since he did a fine job without it, but if I were using a device like that on a day-to-day basis, I would want to know exactly how it worked.  It's just not very satisfying to use a magical black box...

Tuesday, May 10, 2011

Toil and Trouble

One of the first symptoms of my tumor was double vision, since it was putting pressure on my optic nerve.  My doctors had hoped that once the tumor had disappeared, my vision would return to normal, but so far things have been about the same.  Last week, I visited a neuro-ophthalmologist, who prescribed me prisms for my glasses.  I just got them today, and while I'm still on the fence about how much of an improvement they are, I have been enjoying thinking about their physical properties.
Notice the faint lines on my lenses.  These are the temporary stick-on Fresnel prisms that were added to my glasses.  If I decided to keep them, they can be ground into my next pair of lenses.  The strength of eyeglass prisms is measured in prism dioptres (Δ).  My prescription is 2 Δ out, and 2 Δ down, meaning an object 100 cm away would appear shifted by 2 cm horizontally and 2 cm vertically.

I have noticed some interesting effects, aside from the intended image shift.  When we were in a grocery store, the strong overhead lights sometimes would reflect only from one section of lens, creating a bright stripe.  I've also found I get some distortion from the lines themselves, and I need to turn my head slightly to avoid looking through one.

I'll spend plenty more time with them before I make up my mind, but my initial reaction is to be a bit disappointed.  I guess I'm just used to the extensive development of normal eyeglass technology, whereas eyeglass prisms are so rarely needed, little improvement has been made.

Monday, May 2, 2011

On Hiatus

I've been low on energy the past couple days, and tomorrow I'll be heading in for my last cycle of chemo, so don't expect new posts for the next week or so.  Feel free to send me suggestions for things to look into once I'm out, either in the comments or by email.  Thanks to everyone who's been reading so far; it makes me happy to see so much interest in science.

Wednesday, April 20, 2011

Super collide 'er? I just met 'er!

Credit goes to Humorbot 5.0 of Futurama for the title.

I know I said this was going to be about everyday stuff, but in a few months, this will be everyday for me.  Starting in June, I'll be getting proton radiation therapy at Massachusetts General Hospital as part of my cancer treatment.  As a physicist, I'm excited by the idea of having protons fired into my brain, and I decided to look into some of the details of the cyclotron that will be providing the protons.

For those unfamiliar with the term, a cyclotron is similar to a supercollider, but only accelerates particles, rather than smashing them into each other.  It is built as a ring (hence 'cyclo-') with a series of magnets around the circumference.  The magnets gradually accelerate the particles as they circle the ring, until they get to the desired speed.  Generally, the particle speed is given in terms of how much energy the particle has.  The MGH cyclotron gets the protons up to 235 MeV, where MeV is mega electron volts, the energy contained in a million electrons after accelerating through one volt of potential difference.  We can convert this to a velocity using the relativistic kinetic energy equation:
where v is the velocity as a fraction of the speed of light.  Solving for v and plugging in values gives the velocity of the protons as 60% light speed.

As far as relativistic particles go, this isn't stunningly fast, but it's certainly fast enough to get some neat effects.  If there were a clock on the protons that we could read, we would see 4 seconds tick by for every 5 seconds that passed on our clocks.  According to the specs of the MGH cyclotron, it takes 800 turns around the loop to get up to the correct speed.  I couldn't find exactly how big the MGH ring is, but a similar cyclotron has a diameter of 6.6 meters.  Some quick algebra gives the total distance traveled as 16.6 kilometers.  According to us, that trip will take 92.2 microseconds, but if you were riding on the proton, it would only seem like 73.8 microseconds.

Another interesting property of the protons is their Bragg peak.  This is the depth at which the proton deposits the majority of its energy in the material it's traveling through (in this case, my brain).  This plot compares the Bragg peaks for protons and photons (from Wikipedia):

 Notice that the photon (used in typical radiation treatment) peaks almost immediately, and stays relatively high for a significant distance.  The proton, however, peaks sharply at a specific depth, then drops to zero almost immediately.  This is the main advantage of proton therapy over traditional radiation treatments – very little is irradiated aside from what is targeted, reducing side effects.

I hope you haven't been put off by the cancer talk – I'll start on more everyday things tomorrow.