Pages

Showing posts with label Thermodynamics. Show all posts

Monday, May 5, 2025

Oh, what a world, what a world!

A while ago, Marika started making homemade vegetable broth from scraps. The recipe makes a large batch at a time, so we freeze it in cubes to use as needed. Last week, I was defrosting some in the microwave, and I started wondering about the ideal power settings to use. Microwaves are designed to heat the water molecules in food – The molecules are electrically polarized, and the oscillating electric field from the microwave makes them rotate back and forth, which translates into heat. In ice, though, the molecules are locked in a crystal formation, and unable to absorb energy as efficiently. If we run the microwave at full power, a lot of that energy will be wasted until the ice begins to melt. That's why the defrost settings opt for lower power and longer time. Once we get some liquid water though, we could increase the power and let the water conduct heat into the ice it surrounds.

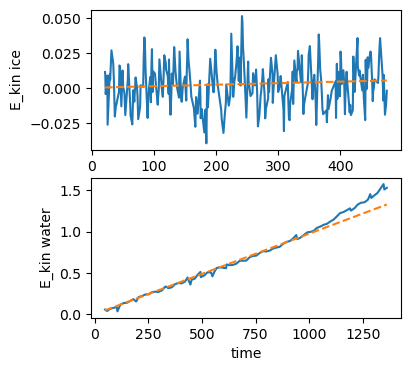
I was able to find a paper on simulations of water and ice in a microwave, which included some nice plots of the energy absorbed over time. I used an online tool to extract the data, then did some linear fits to estimate a power level for each:

You may notice I've left out units on this plot – Usually a major faux pas in physics, but (possibly due to suffering from a cold) I found I had to fudge things a bit to get my simulation to work, so bear with me.

With this information in hand, we can imagine starting with a block of ice at a given temperature, and applying a given amount of power, which is scaled according to the factor found above. Once the ice begins to melt, the water can absorb energy more efficiently, and then transfer that energy to the ice through conduction. Recall that to change phases, materials need to absorb some extra energy, called the latent heat. Therefore, the key points of the simulation are

  • The ice must be heated up to melting point
  • Once at the melting point, additional energy transforms ice to water
  • Water heats up as it absorbs energy
  • Ice can absorb energy from the water according to the volume of water and difference in temperature

We stop the simulation once all the ice has melted. I tried out a series of different power/time settings for melting the ice most efficiently. They're plotted below, with the y-axis showing the fractional power delivered at each time. The length of the line shows how long it took all the ice to melt, and the color shows the total energy used (the area under the curve).

To defrost as quickly as possible, it's best to just blast full power, but this wastes a bunch of energy. To see why, we can look in detail at the max and min total energy cases:

These show that the vast majority of the time is spent just getting the ice up to 0°C. Once that happens, the water begins absorbing energy and speeds up the melting considerably. One caveat with this though is that the energy differences in the above are not huge – This makes sense, since the fraction of power absorbed by the ice and the energy needed to heat it to melting are constant. In my sickened state I didn't have the energy to test out heating routines as much as I'd like. I encourage you to try your own optimization of broth heating.
Wednesday, February 26, 2025

Teach Your Physicist to Suck Eggs

Recently I was reminded of a neat science demo where burning a match inside a bottle can suck in a boiled egg that otherwise wouldn't fit:

I saw similar demos growing up, and I believe I was given the incorrect explanation of the match using up the oxygen to lower the pressure. As the video above points out, it's actually the heat from the fire that makes the air expand and escape from the bottle. After the air cools, the pressure is lower and the atmosphere pushes the egg into the bottle. I was curious whether I could determine the pressures involved in this demo.

Burning the match releases heat, which raises the temperature of the air in the bottle. According to the Energy Information Administration, burning a match releases 1 BTU of energy. Using air's heat capacity, density, and a volume of 1 L, we can calculate that this will raise the temperature by an impressive 1220 K. We can use the ideal gas law to see what that does to the air:

Increasing the temperature, T, will cause the pressure, P, to to go up. This pushes up on the egg allowing some air to escape. If we suppose that the pressure required is very small, we can instead assume all the energy from heating the air goes into expanding the volume, V. We could use this to find the final volume of the air, and thus how much escapes from the bottle, but we don't really care about the air that escapes. Instead, we can just suppose our 1 L bottle of air at a room temperature of 300 K is now at its new temperature of 1520 K, with the pressure remaining constant.

Now we can flip the relation, and suppose the volume and number of particles, N, stays constant. We can write

where the subscripts specify the initial and final states. Using the temperature we calculated and 1 atm of pressure, returning to room temperature would bring the pressure to approximately 0.25 atm. That implies the atmosphere is pushing down with 0.75 atm of net pressure. We can get the area of the egg's cross-section and multiply by the pressure for a force of 110 N, or about 25 lbs. Not enormous, but it's easy to see how applying that force unevenly by pushing with your fingers would just mush the egg.

Turning to the latter part of the video, how about getting the egg out again? The maximum pressure a person can blow is about 0.1 atm, 40% of the pressure that pushed it in. If you watch the video above though, you can see the egg goes into the bottle with a great deal of speed, while getting it out isn't nearly as violent, so these results appear to be consistent. Cool experiment to try if you've never seen it before!

Sunday, January 26, 2025

Water Wedge

The streets around our house have many potholes, which fill up with ice:

Water expands when it freezes, which means when a hole fills with water that freezes, the ice can potentially make the hole bigger. To do this, the ice puts pressure on the asphalt, and vice versa. Adding pressure can make it more difficult for ice to freeze, so I looked up some info on asphalt strength. This paper gave a plot comparing the bond strength for different aging times:

Figure 8

These are all around 2-4 MPa. We can look at the phase diagram for water to see how this would affect freezing:

Wikipedia

This is well within the range where the freezing point is still around 0°C, so we don't need to worry about the pressure we're applying. Water expands by about 9% when it freezes, so we can imagine water filling a crack, then pushing out in all directions:

That's the general idea I had in mind, but getting into the details, the steps I used are

  1. Begin with a flat road. Put a dent in the center with depth y0 (*parameter).
  2. Find all points below the road, and use them to define a polygon.
  3. Find the centroid (center of mass) of the polygon and push all points out by 9%.
  4. Push the polygon down according to its weight (*parameter).
  5. Add points anywhere the separation has passed a threshold.
  6. Adjust points along line for equal spacing.
  7. Repeat from 2.

I added steps 5 and 6 since otherwise the crack just scaled up from the initial dent. We can look at the type of crack these steps give as we cycle through freezes/melts:

This seems a little extreme, but we can take a look at how this changes with the two parameters I marked above. The two qualities I was mainly interested in were the width and depth of the crack. We can see how those change in time with different y0 and weight values:

It makes sense these curves look exponential, since the increase depends on the current size. What really surprised me though was how well-separated these two qualities are according to the input weight and y0. These plots suggest that the width is almost wholly determined by the weight, and the depth by the initial depth. For the depth, this can easily be tied to the exponential behavior – Starting deeper increases the rate the depth increases. A little less obvious is the weight, but if we look at the initial diagram of the setup, the wedge shape of the ice means pushing down also pushes out. A quality of exponential systems is that they can very quickly get away from their starting point if left unchecked – A reminder to keep those roads smooth!

Saturday, September 21, 2024

Looking Radiant

In France we had the fancy induction cooktop, and the camper had gas burners, but now we're back in Michigan with the good old resistive coils I've used most of my life. One thing that's always struck me about these stoves is that then when turned on high, the coils glow red. This is due to black-body radiation, which is the spectrum of light emitted by objects depending on their temperature. For an ideal black-body, the color and brightness will be entirely dependent on the temperature. I wondered whether I could use this to find the temperature the stove heats to:

The Wikipedia page for black-body radiation has a nice chart of the overall color for different temperatures:

Wikipedia

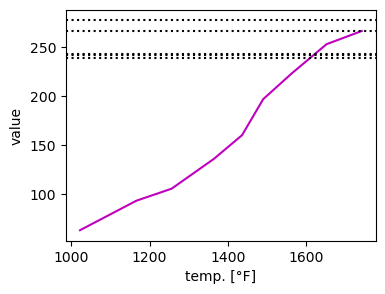
We can get the RGB values of those colors and compare to those from the stove picture:

The solid lines represent the values from the chart, while the dotted lines are samples I took from the image. The red and green aren't bad, but you can see my samples have way too much blue for a true black-body. Ideally, a black-body shouldn't reflect any light, absorbing it all instead. This brought to mind Vantablack, but I'm not sure how that would stand up to high temperatures, and it seems like a dangerous world to get into.

To resolve the discrepancy in color distribution, let's try looking at the overall brightness by taking the root sum squared for the above:

For 3 out of the 5 samples, we get a crossing at around 1600°F. I couldn't find a definitive source for maximum stovetop temperatures, but I found a Reddit post that suggests the range 1470°F to 1652°F, agreeing nicely with my measurements!

The neat thing about black-body radiation is how universal it is: When a welder heats metal to the same brightness as the Sun, it's because they're the same temperature, and the whole universe is still glowing from the heat of the Big Bang!

Sunday, August 18, 2024

Stirring Coffee with My Thumb

Recently I was listening to the song The Frozen Logger, which my father Steve often sang when I was growing up. When I got to the line "at a million degrees below zero" though, the physicist part of my brain butted in to point out that the lowest the temperature can get is absolute zero, or -459.67 °F. Could he have been talking about wind chill? We can rearrange the equation for wind chill to give the velocity required to get from a given true temperature to -1 million °F:

Even at absolute zero, the wind speed would need to be 100 trillion times light speed, which is just not how anything works. A temperature this low is far outside the realm of possibility, but I'm not one to make a fuss over poetic license.

As I was thinking about this though, I started wondering about the other direction: Is there a maximum temperature allowed by physics? One way to think about temperature is the average speed of the molecules in a substance. Using the Maxwell distribution, we can find the temperature associated with an average speed:

Plugging in c for the velocity and the mass of hydrogen, we get a maximum temperature of 7.7 x 10^12 °F. Like the above, this has it's own set of problems: The v in the equation above is the average speed, but the particles all need to stay in (roughly) one place. That means rapidly changing direction, which would require enormous forces. In any case the speed distribution above was derived without considering relativity, so we can't actually apply it to speeds this fast.

I decided to see what possibilities the larger physics community had come up with for maximum temperatures, and I found this article polling some experts. Most of those arguments go back to the early universe, since the Big Bang model of the universe posits that all energy started at a point and has been expanding and cooling since. That concept leads to Planck units, which are combinations of the constants that go into the four fundamental forces in our universe. In the earliest stages of the universe, these forces are believed to have been unified into a single force, but we don't have a model for that yet (the elusive "Unified Field Theory"). The Planck units represent the scale for different quantities at which our understanding begins to break down. For temperature, this is 1.4 x 10^32 K – Converting this to °F doesn't make much difference, since it's still 20 orders of magnitude larger than our previous estimate.

One thing I find really interesting about physics is how well a model can work in one regime, but the same model gives bonkers predictions on a different scale. It's strange to have islands of complete understanding surrounded by seas of uncertainty.

Sunday, June 9, 2024

An Anod(yn)e Dock

This week my in-laws, Scott and Athena, bought a new dock for their lake. They decided on one made from anodized aluminum, and we were talking about its advantages over other materials. They told me that it doesn't heat up as much as other materials, and this made sense to me from baking with aluminum pans: They tend to heat up quickly and evenly, but there's also very little risk of burning yourself on them. I thought this was due to the heat capacity, the relationship between heat and temperature. Colloquially, we tend to equate these, but there's an important difference: Heat measures the internal energy of a substance, while temperature tells how easily it will give up that energy. Heat flows from high temperature to low temperature. Heat capacity measures how quickly temperature changes as heat flows in or out – Water has a relatively high heat capacity, which is why even a small amount of hot water can burn you. Previously, I had thought aluminum's low heat capacity meant that if you touched a high-temperature pan, your finger would cool it much faster than it would heat your finger. It turns out there's a bit more to it than that.

Scott and Athena mentioned that it was important their dock was made from anodized aluminum, rather than natural aluminum. Anodizing is a process that adds a layer of oxide to the surface of a metal, protecting it from corrosion. In the dock's case though, they said that this also made it feel much cooler than the natural aluminum, which would get uncomfortably hot in the sun. This didn't work with my explanation, since anodizing is a surface effect, which wouldn't significantly change the heat capacity of the bulk material. I decided to compare both the heat capacity and the thermal conductivity, which measures how quickly heat flows through substances:

MaterialHeat Cap. [J/kg K]Thermal Cond. [W/m K]
Stainless Steel50214.4
Natural Aluminum921236
Anodized Aluminum9211.07

Contrary to my previous understanding, aluminum actually has a higher heat capacity than steel! In reality the key difference is in the thermal conductivity, for which the three metals have vastly different values.

Sunday, November 19, 2023

Dribble Cup

Earlier this week, I took my water bottle out of the fridge and, without thinking, put it near the small heater we had running. In seconds it was spewing water all over the table!

I figured the heat made the air at the top expand, pushing the water out through the straw, but what I was really curious about was: Does the amount of air the bottle starts with change how much water is forced out?

Air follows the Ideal Gas Law, which is given by

where P is pressure, V volume, N number of molecules, k Boltzmann's constant, and T temperature in Kelvin. That last bit is important: We usually measure temperature in degrees Fahrenheit or Celsius, which can be negative. Kelvin on the other hand is only ever positive: 0 K corresponds to absolute zero. We can convert from Fahrenheit with

In our situation, the temperature rises, which increases the pressure the air applies to the surface of the water. This pushes water out, increasing the air's volume, and bringing the pressure down. At equilibrium then, we can set the initial and final pressures equal. Similarly, the number of molecules won't change, since no air is entering or exiting. Using that, we can write the ideal gas law for the initial and final states, then set them equal:

What we're really interested in though is the change in volume, since that tells how much of a mess we're making:

We can plot this for a couple different initial volumes over the temperature range from refrigerator to heater-adjacent:

The green line is half full for my water bottle, and will spit out a couple tablespoons worth! As I write this, Marika is using the Instant Pot for some dinner prep – I'm surrounded by pressure vessels ready to blow!

Sunday, May 7, 2023

Till Birnam Wood Remove to Dunsinane

Until their recent switch to heat pumps, my parents heated their house primarily with a wood stove. For my whole life, my mother Sally has been responsible for splitting the logs they bought to a suitable size. Even at 71 years old, she continues to perform this task for the occasional fire they still enjoy. In preparation for installing more solar cells, they recently had part of the woods around the house cleared, and Sally has been splitting it. During that process, she asked me: How much does split wood dry over time? How much difference does the surface area of the pieces make? (Pieces split from wider diameter vs smaller diameter)

Here's a picture she took showing some different splits:

We want all the pieces to have roughly the same mass, but depending on the diameter of the log, this will mean different thicknesses of wedges. Intuitively, a thicker wedge will take longer to dry, since the water has farther to travel through the wood. I wasn't sure how I could model this, since there are so many factors that come into it, like the surrounding air temperature and humidity, not to mention the spread of the water inside the logs. Luckily, the USDA came to my rescue with an extensive document on drying lumber!

They compared the moisture level in pieces of lumber, varying the location in the US, thickness, type of wood, and date of stacking. Unfortunately, the way they present the data does not help to answer Sally's question: They show separate plots for each thickness, but we want to see how a changing thickness affects the drying time. To replot the data in a way to answer that, we first need to get the actual values. Normally, I'd take a couple points by eye, but I wanted to get more samples than I would have patience to do manually. I figured someone out there must have developed a tool for reading data from plots, and indeed they had! Using that, I got the data for the samples taken in Worcester, MA for Northern Red Oak, then did some interpolation and rearranging to get a plot of the drying times for wood stacked around September:

Where is gets really interesting is when we look at how this curve changes depending on the stacking date:

Interestingly, if you stack during the Fall, the times are fairly linear in thickness, but if you were stacking it now, there's a sharp climb for larger thicknesses. It's amazing to have mom who both asks questions like this, and has the stamina and will to test my findings – Thank you, Sally, for all the years of keeping me warm and thinking, and here's to many more!

Sunday, February 5, 2023

Chilling Reports

This weekend, Mt. Washington in New Hampshire set a record for the lowest measured wind chill. I've always been a bit bothered by the idea of wind chill, since it doesn't represent what temperature it is, but instead what temperature it feels like, which seems a bit subjective. I thought I'd take a closer look at how wind chill is calculated.

There are several different models for calculating wind chill, but the principle is the same: In calm conditions, a boundary of warmer air will build up between your body and the colder air, which will slow the heat loss, but strong winds will replace that boundary with the cold air, cooling you faster. In spite of this faster cooling, you'll never get colder than the actual temperature of the air, so if you sit on top of Mt. Washington you can rest assured you won't go all the way to -108°F, but instead stay at a balmy -47°F.

Thinking about it a bit more, I suppose my real problem with wind chill is that it's using the wrong units for what it's measuring: Wind chill is meant to convey the rate of heat loss, so that's how it should be measured. That's what the original model, called the wind chill index, measured with units of kilocalories/hour/meter^2. What's nice about this is that you can clearly see that your total energy loss will depend on how long you're outside, and how exposed you are.

If you look at the Wikipedia page above, you can see the different equations for the wind chill index and the wind chill temperature. On the surface they look similar, but the wind chill temperature has a very unusual 0.16 power, which only makes me more uncomfortable with the measure. We can look at how the two compare for a range of temperature and wind speed values:


The shapes are similar, but the wind chill index has more of a bulge, indicating that it is more sensitive to the wind speed than the wind chill temperature.

The Wikipedia article states "Many formulas exist for wind chill because, unlike temperature, wind chill has no universally agreed upon standard definition or measurement. All the formulas attempt to qualitatively predict the effect of wind on the temperature humans perceive." It seems a bit silly to tout a record based on an arbitrary perception of temperature – Ever since chemo, I've found myself more easily chilled than I used to be, so maybe I'll define my own wind chill measure: The usual wind chill temperature, minus 5 degrees. New record set!

Saturday, July 2, 2022

Dreamt of in Your Philosophy

This week, I got several questions from Papou about the Big Bang and thermodynamics:

Is the Universe a closed system?

In order to answer this, we need to define what is meant by a "closed system": This is where no matter or energy enters or leaves the system under consideration. That means that the Earth, which gets energy from the Sun and radiates it back into space, is not a closed system. The Universe, however, which contains all matter and energy observed, is a closed system.

A different question, which uses confusingly similar terms, is whether the Universe is open or closed in the geometric sense. This refers to what happens if you travel in a straight line: Do you eventually come back to where you started, like you would on the surface of the Earth? Due to the influence of dark energy, for our universe the answer is no, it is geometrically open, whatever Modest Mouse may tell you.

How do the Laws of Thermodynamics apply to the Big Bang Theory?

Before we dive into this, let's talk about what the laws of thermodynamics are:

  1. The energy in a closed system remains constant.
  2. In any process, the entropy of the system must increase or stay the same.
  3. As temperature approaches absolute zero, entropy approaches a constant
These are sometimes summarized as
  1. You can't win.
  2. You must lose.
  3. You have to play the game.

I've mentioned entropy a couple of times on this blog, each time in a slightly different context. In this case, it can be thought of as energy that can no longer be used for work. As an example, if you have a bottle of compressed air, you could use it to propel a cart or turn a pinwheel, but if everything's at the same pressure, the air won't flow. This is actually the plot of a short story I read recently called Exhalation, about robots powered by compressed gas.

The Big Bang theory states that all matter and energy in the Universe started at a single point, which expanded outward. We can check off the first law, since the theory isn't saying anything about where that point came from – The Universe started with some fixed energy, and that energy is still here, just more spread out. That last part applies to laws 2 and 3 – Spreading out means more possible states for the matter, and lower temperature. It's these laws that lead to the heat death of the Universe, which I described before.

What is the impact of the Laws of Thermodynamics on Evolution?

The laws I outlined above are sometimes used as an argument against evolution: Evolution makes things more ordered, but that violates the increasing entropy requirement. The key is that the second law doesn't say entropy everywhere increases, just that it increases in the system as a whole. It's true that a human body has less entropy than a pile of microbes of the same mass, but that skips all the entropy generated in producing a human body. For a (slightly) more detailed discussion, I found this page, written by Robert Oerter at George Mason University.

Can there ever be enough Hawking Radiation to eliminate a Black Hole?

Yes! Hawking radiation is a process by which black holes can emit particles, but according to the first law up above, that means the black hole must lose energy/mass. If this happens over enough time, or the black hole is small enough, it can eventually evaporate. When the Large Hadron Collider first started up, some people (not scientists) were afraid it would create a black hole that would swallow the Earth. Experts were confident that if it did create one of the hypothesized microscopic black holes, they would quickly evaporate under Hawking radiation.

Thanks for more great questions, Papou!

Sunday, September 5, 2021

On the rEvolution of Doorways

Dipping once again this week into my list of topics, I chose a particularly old one: revolving doors. Ever since my stay at Mass. General Hospital, I've been curious how efficient revolving doors are at keeping heat in or out, compared with sliding doors. Last time, aside from the disadvantage of chemo effects, I attempted to do a detailed simulation of the motion of particles through the doorway, which never panned out. This time, I took a much simpler approach using an approximation for the rate of heat flow between two reservoirs:

where Q is the heat energy transferred in a time Δt through a surface of area A. The temperature difference ΔT between the two reservoirs is spread over a distance Δx, and the thermal conductivity k is a property of the air, which we can look up. The idea with a revolving door is that the inside and outside are never in direct contact: The air moves from outside, to a segment of the door, then to the inside. I wasn't sure how to get the distance, since it will change with time as the air moves, but I went with a guess of 20 cm. For the dimensions of the door, I found an architecture page that gave some example measurements. I went for a 3-segment door. For each person who enters, the door will turn 120°, so we can try a few different rates.

Along with the heat transferred, we need to know the current temperature in each section of the door. That will be a simple scale factor, the heat capacity. Since the change in energy/temperature is proportional to the current energy/temperature, we'll get an exponential relationship in time, where the door section will approach the in/outdoor temperature, but never quite make it.

I put together a simulation with some values more suited to my current Florida environment: 20°C (68°F) inside and 35°C (95°F) outside. First, we can look at the temperature in each section of the door as it rotates with 1 person every 30 seconds:
I was surprised how consistent the temperature stayed – In total it's only about half a degree C in variation. To get a visualization of what was going on, I made an animation from the same run:

I find it really interesting that the oscillations are consistent enough that the door segments return to their original uniform temperature about every 1.5 minutes. I did not expect such a clean result.

Turning to the comparison with the sliding door, we can consider having direct contact between the inside and outside temperatures for the same time it takes for a person to go through the revolving door. We can add up the energy transfer over time for different rates of entry for both the sliding and revolving door. Below I've plotted the results on a log-log scale:
According to this model, the revolving door is only more efficient if more than 120 people per hour are going in/out. However, I suspect this could change drastically with the choice of the temperature spreading distance I mentioned earlier. A more reliable result may be that all the revolving door cases lose nearly the same amount of energy. I've often scoffed at airports that have motorized continuously rotating doors, on the belief that they were wasting power pumping air between the inside and outside, but perhaps I owe those architects an apology!

Sunday, August 15, 2021

The Terror of Knowing What's Inside This Pot


Marika and I recently got an Instant Pot pressure cooker, which we've been enjoying making meals with. Naturally, I was curious about the inner workings of the pot, specifically how the temperature and pressure inside vary with time.

The concept behind a pressure cooker is that when cooking food in water, you typically can't heat it beyond the boiling point: Once the water reaches boiling, any energy you add just goes into making steam. Sometimes you want to cook things at higher temperatures, which is why frying uses oil. That's not very healthy, though, so it would be great to raise the boiling of water. You can do that a little bit by adding salt, which is often suggested for pasta, but that doesn't go quite far enough. Instead, you can put the water under pressure, which raises the boiling point.

A pressure cooker is a sealed container that you add water to, and then heat. As the water evaporates, the pressure builds inside the cooker, raising the boiling point. The pressure depends both on the temperature of the steam, and the number of water molecules that have evaporated:
This is the ideal gas law, with T the temperature in Kelvin, V the volume, R a constant, and n the number of moles of gas molecules. A mole is a way to count very large numbers of things, equal to Avogadro's number, 6.022 * 10^23. My grandfather, a chemist, used to say that he and my grandmother had "Avogadro's Anniversary", because they were married on 10/23.

In order to add molecules to the steam though, we need to boil the water. The temperature that water boils at will change as the pressure increases. Even after we get to boiling, we need to overcome the latent heat to get the water out of the liquid phase and into steam. To accomplish either of these goals, we need to add energy to the system, which translates into temperature through the heat capacity.

Putting all this together with the specs of our model, we can look at the temperature and pressure for two cases: The minimum amount of liquid in the pot, 2 cups, and about half-full, 12 cups.


I was surprised by how quickly the pressure rises once we hit boiling – I kept a constant amount of power throughout the calculation, which causes the pressure to quickly exceed the working range of the pot. You can see the extra energy being used to push more molecules into steam in the sudden change in slope of the temperature plots.

I was hoping that by studying pressure cookers a bit more closely, I'd find them less terrifying to use, but I'm not sure these results are very soothing! I'll just have to keep singing to myself, "Mm ba ba de, Um bum ba de, Um bu bu bum da de..."

Saturday, December 19, 2020

Putting the Squeeze on 'Em

As I went to get some shampoo in the shower earlier this week, I had a familiar experience: The bottle was running low, so we stored it upside down. Sometimes the air trapped inside is at a higher pressure than the surrounding air, which causes shampoo to be forced out by the extra pressure. Normally, I'd stop this by squeezing the bottle in a way to suck the shampoo back in, but the brand we have right now uses bottles with a circular cross-section, so that didn't work. It did get me thinking about how the right geometry lets me control the pressure inside the bottle.


Most of the shampoo bottles I've used in the past have had a cross-section that's roughly elliptical, which have an area of


where a and b are the half-width, and half-height. If I squeeze on the longer axis, I can shrink a and expand b, which changes the area:


We need to choose a precise relationship between a and b – I decided the ellipse should have a constant perimeter. That can be calculated with

Unfortunately, there's no closed-form solution for this, so instead I set up a Python script to calculate it. The pressure in the bottle will be inversely proportional to the volume, which for any cylindrical shape is just the area times the height, so we can write
where p and A are the initial pressure and area. Now, given a change in a, we can find the value of b that keeps the perimeter constant, then get the area, and then the change in pressure. Using a fixed value of 1 for the initial b size, we can try a couple different values for the initial a size to see how they react to squeezing:

Increasing the width by squeezing along the smaller axis always increases the pressure, which makes the shampoo come out of the bottle. The wider the large axis is, the more difference squeezing it makes, but if a = b = 1 like the bottles we were finishing, then any amount of squeezing will increase the pressure, resulting in too much shampoo!

Saturday, November 28, 2020

The Summer of Heat & the Winter of Desiccation

Thanksgiving put baking on my mind, and I started thinking about a post I wrote several years ago about baking a cake in different sized pans. I had been concerned in that post that I didn't take into account the evaporation of water from the cake, which would change the way it heated. This week though, I thought of a way to account for that, and decided to follow up on my previous post (and continue the French Revolution theme).

To recap, my mother Sally was baking a cake, but her pan was smaller than the recipe called for. That meant the cake would be thicker, and she wondered how that would change the cooking time. The key to figuring out how temperature changes spread through an object is the heat equation:


This says that the change in temperature at a point is proportional to the variation in temperature at the surrounding points. I mentioned last time that it was the proportionality constant, α, that depended on the moisture content of the cake batter. I realized that we could account for a changing amount of water by varying α according to

where m is the mass of water and of other ingredients in the cake, and α the individual diffusivities. I was surprised to find that a group of food engineers (!) had actually measured the thermal diffusivity of flour. Taking a sheet cake recipe as an example, we can approximate the amount of liquid (~water) and the amount of flour to get the effective α.

It still remains to determine how the amount of water changes over time. I looked into a couple ways to tackle this, and I'm not sure how accurate my technique is, but it made the most sense to me: The particles of a substance at a certain temperature have a statistical distribution of energies. For ideal gases, there's the Maxwell-Boltzmann distribution, and even though that's not a great model for liquid water we'll go for it. It takes a certain amount of energy for water to evaporate, called the heat of vaporization. If we assume that all the molecules with this much energy do leave the solution, we can keep track of the current number of water molecules still in the cake. Taking out those high-energy particles will also cool the cake, so we can figure out the temperature change with the heat capacity.

I updated the previous code to include these new modifications. Once again, we start off by measuring the temperature after a given amount of time using the wider pan:


In contrast to the previous results, the center temperature goes well above water's boiling point! We can also look at how the amount of water changes over time:


I was surprised to see that the center of the cake experiences almost no loss in water. Even the edges don't lose much – The color scale varies from 50 to 60%. To check what effect the loss of water has, I reran the test with the same α calculated above, but left the amount of water constant. The results are almost identical:

As in the previous post, we can use that central temperature as a target for the narrower pan, and find the cook time:

As before, we get about 70 minutes, suggesting the water content is not as significant as I imagined. A big part of physics is figuring out what you can approximate, and what you can't – which results are "good enough". It seems cakes can be quite forgiving when it comes to baking precision!