Pages

Showing posts with label Statistical Mechanics. Show all posts

Sunday, May 14, 2023

Speakhard

I recently came across the term password entropy, and I was curious how it related to the thermodynamic type of entropy I'm used to as a physicist. When choosing a password, we want to create something that's hard to guess. That means there should be as many possibilities as we can manage. That's why accounts frequently require you to include upper- and lower-case letters, numbers, and symbols. By increasing the variety of characters, there are more possible passwords you could make. To characterize the number of choices, people sometimes define the "bits of entropy" as

where M is the number of possible passwords. The term "bits" is meant in the computational context: either a 0 or 1, with 8 bits making a byte, and kilobyte/megabyte further scaling by 1024 each.

This is essentially the same, up to a constant factor, as the type of entropy used in thermodynamics, where instead of character combinations, we have microstates of a system (see the post I linked above for more details). It turns out we can connect these concepts through a thought experiment called Maxwell's Demon: Imagine we have a box filled with gas and divided into two sections, with a door between them that can be opened and closed. If the gas in one side of the box is warmer than the other, we can extract energy from the box using a heat engine. Once the two sides are the same temperature though, we can no longer perform work using them. However, temperature gives the average energy of the gas molecules: Some will be moving faster, and some slower. Suppose we had a device (or a demon, if our research grant covers soul exchanges) that could detect when a slow molecule approached the door from the left, or a fast molecule came from the right, and could quickly open and close the door to let that molecule through. Then we could make the two halves different temperatures again, decreasing the entropy and allowing more work to be extracted!

The sticking point though is how this demon decides whether to open the door or not. As we saw above, information carries entropy of its own, and the knowledge of whether the door should be opened for a particle cancels out the decrease in entropy caused by the temperature difference. There are some interesting details on that in the Wikipedia article, but there was another aspect of password choices that I wanted to explore, related to this xkcd comic. Generally, increasing the length of the password, or the types of characters allowed in the password will increase the entropy, but requiring certain character types can make the entropy go down. Below you'll find a little JavaScript tool to calculate the entropy for different requirements.

Sunday, April 9, 2023

Anneal Before Zod

Almost a year ago, I promised to talk about annealing, and now I'm finally getting around to it! I mentioned that you might be more familiar with it than you think, and that's because it's behind something often referred to as the Brazil Nut Effect. I'm not a big fan of mixed nuts, but I do like granola:

Granola will typically have a variety of sizes of cluster, and shaking the bag causes the larger clusters to rise to the top. This happens because the smaller clusters can pack together more densely, and by having those lower in the bag, the system is in a lower energy state. What's interesting is how we got to that lower energy – By shaking the bag, we're adding energy. This seems counterintuitive, but it's the process behind annealing.

If we imagine a potential energy plot like the one I showed a few weeks ago, we can think about how to find the lowest energy state:

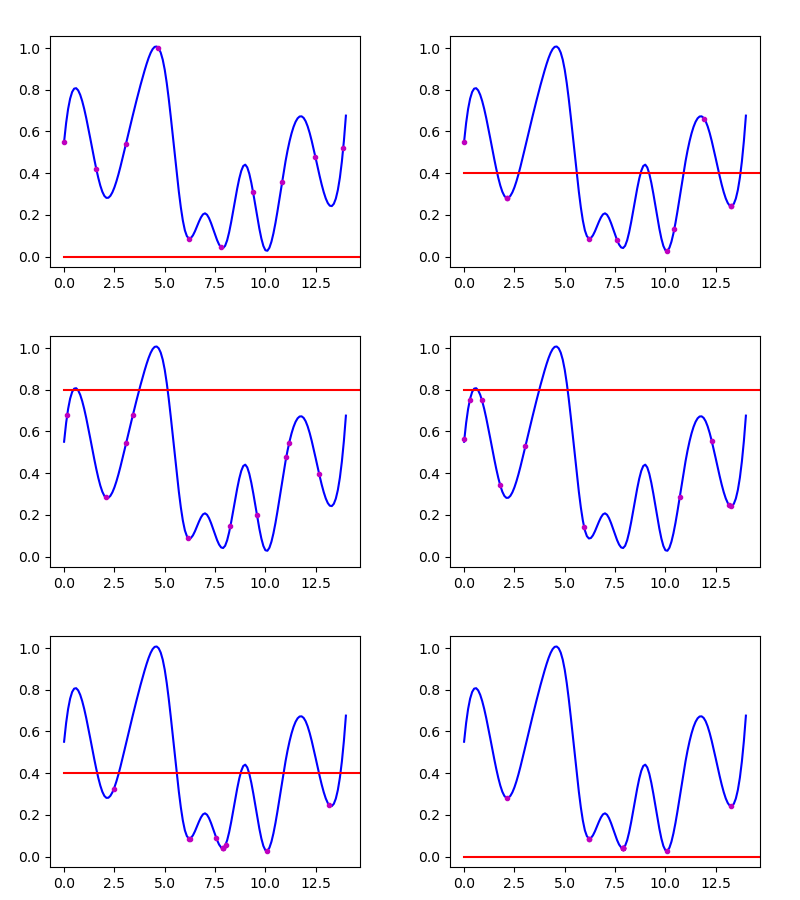
We could think about rolling a ball over these hills – We'd like it to settle in the lowest troughs, around 7.5 or 10, but it could get stuck in the ones at 2 and 13, analogous to the large clusters being stuck at the bottom of the bag. To solve this, we can give the ball a temperature, which represents an average velocity. By increasing the temperature, we can get the ball to explore the full range of states, then cool it down gradually to allow it to settle in the lowest-energy position. In the graph below, I've done this with several balls, initially spaced across the full range. The red line shows the temperature, which rises and falls.

A few balls still get trapped in the higher energy states, but the majority find those central troughs. Every time I shake a container to get things to settle, I think about this effect – Maybe now you will too!

Sunday, January 29, 2023

Banditopod

Recently as part of my research, I've been trying to measure a probability distribution – specifically, the chances that we've seen a certain signal in LISA. The trouble is, there are many random noise factors that go into the calculation of whether we see the signal or not, so it's not a straight equation I can plug things into. Instead we need to sample it many times to estimate the distribution, and this can be expensive. My colleague Henri suggested I could use a technique called Markov Chain Monte Carlo (MCMC). I thought to get a better feel for the method, I'd try out a simple example here.

There's a traditional problem in probability theory called the "two-armed bandit." Imagine a slot machine with two levers – You insert a coin and choose which lever to pull. Each arm has a certain probability of paying out, but the only way to find out is by playing, and looking at how often you win or lose. What then is the best strategy for choosing a lever? You may have gotten lucky your first few pulls of one lever and overestimated its chances of winning.

We can make this more like my research by extending to a multi-armed bandit – Each arm represents a set of parameters we're searching for, and we want to pick the arm with the biggest payout/best fit to the data. Still to be answered though is how we pick which arm to play: Imagine a set of players, who can choose an arm at each step based on the wins/loses they've seen. Each one is more likely to pick an arm with lots of wins, but might try another arm just in case. Now, if we look at the estimated probabilities for each arm as time goes on, we might think we'd get a good idea of the true values:

The blue line is the true probability for each arm, and the orange dots are the estimates based on the average number of wins. The dots are jumping around so much though that it's hard to see how well we're doing. Instead of animating in time, we can try looking at how frequently we play each arm:

Pretty quickly, each arm gets a consistent rate of pulls, but it looks like we're undersampling the highest-probability arms. I think this may be due to the top-probability arms having fairly similar values – As I pointed out above, we can't tell whether we have the best lever, or just a streak of luck, so we hedge our bets. A common technique with MCMC is run a "burn in" for a while to let the players move around the parameter space, then reset the probability estimates and continue running.

As a final view of the data, we look at how the players distribute themselves among the arms through time [NB: The x-values are off by 1 compared to the earlier plot due to the way I gave the distribution to the MCMC tool I used]:

It starts off fairly flat – the parameter exploration I was talking about – but after a certain point, the distribution establishes itself, and from there the shape simply scales upward. However, even if you could afford to play tens of thousands of times, I think you'll be hard-pressed to find a slot machine paying out as frequently as these!

Sunday, April 18, 2021

Stochastic & Fantastic

As I've mentioned before, I keep a list of potential topics that I choose from now and then, and this week I thought I'd look back at an article that caught my interest 2 years ago. Scientific American had a story about a beetle that looked for recently-burned forests using a process called stochastic resonance. The beetles use this process to sense heat from great distances, when normally those heat signals would fall below the background levels. Paradoxically, they do this by adding more noise to the signal. I was curious if I could model this type of effect, to get a better feel for how it works.

In its simplest form, we have 3 parameters for this system: The signal strength, the amount of noise added to that, and the threshold for detection. The principle is that even if the signal is smaller than the noise, we still have signal + noise > noise. That means if we can pick our threshold so that noise < threshold < noise + signal, we'll be able to pick up the signal.

Following an example used in the Wikipedia article above, I decided to use a black & white image as the target signal. I settled on one of the more iconic photos of a certain physicist. Below, you'll find the 3 controls I described. Try turning down the overall signal, then adjust the noise and threshold to pick out different features.

Sunday, February 14, 2021

Carbon Catch-and-Release

Around 15 years ago, my father Steve and I were browsing in T. J. Maxx (which I'll forever think of as "Temporal Jail: Maximum Security" thanks to Jasper Fforde) and came across a soda siphon, aka the seltzer bottles that seem to only appear in old movies for comedians to spray each other with. We decided to buy one, and we've continued using them to this day (after spraying each other with it a couple times, naturally).

If you've ever seen one used, the force of the water when it sprays out is impressive, and I was curious if I could derive how fast it's moving. In looking for an answer, I found the Hagen-Poiseuille equation, which relates a change in pressure to the flow of a liquid:

where μ is the viscosity of the water, L the length of the pipe, Vdot the volume flow rate, and r the radius of the pipe. The pressure difference is simply the pressure we add when we charge up the bottle. The CO2 cylinders that go in the bottle (yes, we buy 100 at a time) hold 8 grams of gas each, to charge 1 liter of water. To find the pressure that results in, we can use the Ideal Gas Law:
where n is the number of moles of gas, R is a constant, and T is the temperature. We can get the number of moles from the molar mass of carbon and oxygen. Putting everything together, and solving the differential equation gives
where Vtot is the total volume of the bottle, and V0 is the initial amount of water. I tried plotting this, but I was having some trouble with the units – I think I missed a factor of 1000 somewhere between the millipascals, (kilo)grams, and centimeters. I wound up fudging it to get more reasonable results:
This says that the bottle will be empty in about 8 seconds (and probably not 8 milliseconds, as I initially calculated). For the velocity we get

For reference, 1 cm/s at the top of this graph is about 2 feet every minute, which is way too slow, but leaving in the factor of 1000 is way too fast! I'm not sure where I went wrong with this, but it may be that the Hagen-Poiseuille equation is not the right one to use here – Wikipedia says it "describes the pressure drop due to the viscosity of the fluid", and so it may not apply to the flow due to the difference in pressure. Oh, well – Another of Nate's "that didn't work!" posts.

Sunday, April 26, 2020

Clean My Room? Bah!

When we were running our Roomba this week, it seemed like it was bouncing around forever in my office, and when it finally left, came back a minute later! It made me start wondering about how the shape of the room affects the time the Roomba spends in it.

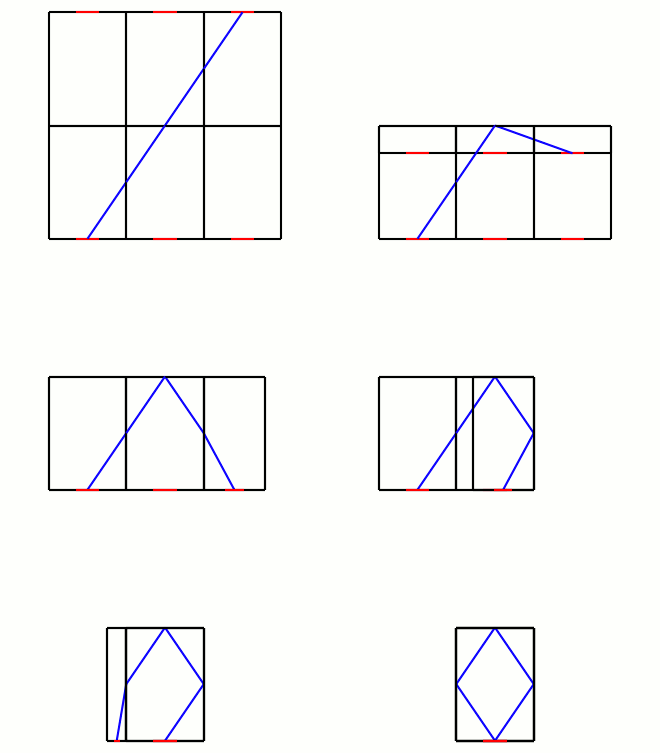
According to Roomba's marketing, it's meant to learn the layout of rooms, and trace over them efficiently, but for the purposes of a simple model, let's suppose it simply reflects off the walls like a mirror. The advantage of this behavior is that instead of worrying about the angles of the collisions, we can imagine the Roomba passing through the wall into a mirrored version of the room:
What we're looking for is the distance the Roomba travels to get from one doorway to one of the mirrored ones. If we go m doors up and n doors over, the distance will be
where l and w are the length and width of the room. The requirement for exiting the room is
where θ is the angle the Roomba enters the room, and d is the width of the door. I wasn't able to find a way to get the smallest m/n for a particular room size, so I took a large random sample, and plotted the results:
The y-axis is the distance traveled by the Roomba before exiting the room, averaged over entry angles. The color shows the length of the room, but if we average over that as well,
As the room gets larger, the distance traveled begins to taper off. This suggests the time the Roomba spends in a room is more related to the room's linear size than its area. Even that tapers, so there's evidently other factors:
It seems if I want the least interference from the Roomba, I should work inside a small box!

Saturday, April 18, 2020

Gold Standard

My brother-in-law Alex is a fan of anime, and recently I saw him watching One Piece, a show I wrote about long ago. Since making that post, I learned about a better model for the situation, and I thought I'd revisit it, and see whether the writers know their statistical mechanics!

As a reminder, the main character in the show, Monkey D. Luffy, is described as a Rubberman. Rubber is a type of polymer, which means it consists of a chain of repeating units, called monomers. As we physicists often do, we can take the absolute simplest form of this: Each link of length a either goes up or down, with equal probability.

We can find the length of the chain and the total number of segments in terms of the number that go up, and the number that go down:
What's interesting about this model is that these equations do not specify specific links in the chain, only the total number that go up or down. That means we have a system with indistinct microstates, and entropy becomes relevant. For a system like this, the entropy is given by

What does all of this have to do with stretching though? For that, we turn to the first law of thermodynamics:
where U is the internal energy of the system, dQ is the heat added to the system, and dW is the work done on the system. For our system, we want to keep the energy constant, so we can set dU = 0, and the second law of thermodynamics gives dQ = T dS. The work done on the system is a force applied by the chain multiplied by a displacement, or dW = -f dL. The work is negative because the chain pulls in the opposite direction it's stretched. Putting all this together, we get

To find this derivative, we can solve the first 3 equations together to get S in terms of N and L. Skipping all the algebra involved, we end up with
where L0 is the length with no force applied. To find a and N, we can look back at the diagram from last time:

The sphere's mass is 29 million kilograms, and we can multiply by g to get the force. The temperature is around 300 K. We can get L from the diagram, and according to DaVinci, Luffy's unburdened arm span L0 should be the same as his height.
Wikipedia
Rearranging the equation above,
Plugging in the values, B = 26.8 m, but A = exp(1.3729469e+29 m^-1), which is an absolutely enormous number. That suggests that for a and N to be close to the same order of magnitude, we would need around a quadrillion links, each on the order of femtometers. I thought maybe a more detailed analysis would make this situation a little more understandable, but that ball is just too damn heavy!

Sunday, January 5, 2020

Mathematics: The Shuffling

Recently, my brother-in-law Alex has been into the card game Magic: The Gathering. Over the holidays he had the whole family playing, and the question came up of how many times a deck needs to be shuffled to be "random". For an ordinary 52-card deck, the oft-quoted result of 7 was originally given in a New York Times article from 1990. Doing a bit more research, I found a paper following up on that article with a few more details. I wasn't entirely satisfied with that, both because the shuffles described didn't quite match my techniques, and because I found the probability calculations difficult to follow in my first jet-lagged, and now sickened state, so I wrote some code to simulate a series of shuffles. The two types of shuffle I usually do are:

Riffle: Split the deck in two, and interleave the piles, roughly alternating. I modeled this as a split using a Gaussian distribution around the center, and then picking from the two piles with 50/50 chance.

Overhand: Holding the deck in one hand, move packs of cards to the other. I modeled this as splitting the deck into a set number of unequal packs, and reversing the order of those packs.

Now we have to figure out the quality of these shuffles. I've talked about one way to measure randomness before, but that doesn't really apply here, since all the cards (in a standard deck anyway) are unique. For a deck labeled 1-52, the two quality measures I came up with are: the total number of cards in sequences, and the distance of each card from its original position. Over a series of shuffles, here are the means and standard deviations for those two measures on a set of 5000 decks:


For both distance measures, the riffle shuffle appears to reach a stable value in fewer shuffles. Breaking up runs is clearly not a strong suit of the overhand shuffle, but it moves cards from their original position pretty quickly. As far as the minimum number of shuffles though, it appears 7 is a reliable choice, but you could get away with fewer on average.

Sunday, December 1, 2019

Hysterainy

I've been enduring a lot of rain lately, both in Italy, and now back in Annecy. I'm always frustrated by intermittent rain, since I have to wonder whether it's worthwhile to open/close my umbrella when the rain starts/stops. Whenever I start thinking about it, I'm reminded of the idea of magnetic hysteresis. This is the tendency of magnetic systems to "remember" the state they were in earlier, even when outside conditions change.

The classic model system for this is the Ising model, which I discussed in an earlier post. The difference here is that we vary the external field and see how the system's internal field reacts. The typical plot looks like this:
Based on Wikipedia
On the x-axis is the applied external field (how much it's raining), and on the y-axis is the field within the system (how likely I am to have my umbrella open). Starting in the center, with both fields zero, we slowly increase the external field, which brings the system along with it. When we decrease the field though, the system lags behind, still giving a positive field when the external one is negative, just like keeping my umbrella up while it's not raining.

I decided to adapt my previous Ising script to try to demonstrate this effect, and I was surprised by my success: Hysteresis.py


On the left is the grid of magnetic spins, which interact with their neighbors and the external field. On the right is a plot of the external field vs the average field of the spins. Aside from the weird jiggling frame I couldn't get rid of, it matches the model above pretty well!

Marika and I are packing things up to return to the States in a couple weeks, so I may miss posting.

Sunday, February 24, 2019

Entropy Inquiry

[I originally made this post 8 years ago, but while I was going through old posts this weekend adding labels, it somehow got marked as new.]

I've been working on a post for a little while now, but getting stuck in some of the calculations, so I've been delayed.  However, I just received a question from my brother, Nate, that I thought I could answer a little more easily.
I was listening to a podcast  yesterday that sidetracked into a discussion of what you'd need to make a fully-sentient AI system, and got to thinking about randomness.

Most "random number generators" on computers are actually pseudo-random-number algorithms.  They're deterministic, but the results are surprising and random-looking.  Like f(x)=10, f(x+1)=284, f(x+2)=-5926, f(x+3)=9

But cryptographic applications demand true randomness, and so lots of work has gone into designing entropy-gathering systems for your computer.  Now your machine can watch all kinds of things like the last key you typed, or the axil-tilt of your laptop's motion sensors, or the last seek-time of your hard drive.  It collects this randomness, and can give a "real" random number when you need one.

So my question for Fundamental Forces is
* Are the numbers we get from these entropy sources /really/ theoretically random?  If you had infinite physicists and computers, could you predict a coin-flip?
* If that's not theoretically random, how might we get there?
* Does true randomness exist?  If yes, how can we know that it's Truly Random and not just really complex-looking?
 The answers to these questions requires a little clarification of what exactly "random" is.  I'm going to assume that "random" means that given any amount of information you wish, the result is still not predictable with a reasonable amount of certainty.  In this case, anything macroscopic, like a coin-flip or hardware measurement, is not random because they follow the classical laws of motion.  Given the initial conditions, these laws will predict the results.  However, it should be noted that these initial conditions can often be exceedingly complex, and difficult to determine, hence the notion of pseudo-randomness.

True randomness, though, is possible through quantum mechanics.  In quantum mechanical systems, particles occupy various "states," which specify properties like position and velocity.  However, a given particle can be in a superposition of states, where each is assigned a probability.  Note that this is not the same as saying the particle is in one of the states and we simply don't know which; the distinction was famously proven by Bell's theorem.  By setting up an experiment which depends on the particle being in one of the particular states for a particular result, we can get truly random results by feeding in particles in superpositions.

This might seem like an impractical proposition for the field of computer science, but it's actually much simpler than it sounds.  A number of years ago, I came across a site showing how to build an alpha radiation visualizer out of a webcam and a smoke detector.  Certain smoke detectors use a small amount of radioactive material as part of their instrumentation.  Directing this radiation into the CCD of a webcam creates small sparks of light, called Cherenkov radiation.  Since the radiation is happening on an atomic scale, it's governed by quantum mechanics, but the light detected by the camera can be used as a source of random numbers (for example, the time between light bursts, or the location they are detected).

Thanks for the question, Nate.  Everyone should feel free to send me their own.

Saturday, January 5, 2019

Bubble Trouble


To celebrate New Years this past week, I got myself a bottle of hard cider, fearing the looks I would get for buying cheap champagne in the country of its origin. Since I'm still outfitting my apartment here, I had no way to cork the bottle after opening, but I was impressed with how long it kept its carbonation in the refrigerator. I thought I'd look into some of the models for gas solubility at different temperatures to understand the contributing factors.

Carbonated drinks are so named because they consist of carbon dioxide dissolved in liquid. The bubbles you see (and taste) on opening a bottle are pockets of CO2 coming out of solution. The amount of CO2 that stays in solution is given by Henry's Law:
where p is the partial pressure of the gas outside the liquid, kH is a coefficient that changes with temperature, and c is the concentration of the dissolved gas. Partial pressure means the fraction of overall pressure due to the specific gas that's dissolved, in this case the amount of CO2 in the atmosphere. As with any model, we're making approximations here, like the assumption that the CO2 acts like an ideal gas, only interacting with itself.

We're trying to compare the amount of CO2 that stays in the cider when refrigerated and at room temperature, so we need to look at how kH varies:
where k0 is kH at reference temperature T0, and C is a constant that depends on the gas being considered. The link above gives for CO2 at room temperature k0 = 29.41 L atm/mol, C = 2400 K, and T0 = 298 K. A typical temperature for refrigerators is 40°F or 277.6 K. Plugging these in, we find that kH will be about 55% smaller in the refrigerator. Since the partial pressure is the same inside and out, that means the concentration in the refrigerator is 1/0.55 = 80% larger than at room temperature.

When I started looking into this, I thought I would be finding a time it took to lose a given amount of carbonation, and the process would be slower in the fridge, but this model suggests that the carbonation will stay indefinitely. I think that's because even though having the CO2 outside the liquid is a lower-energy state overall, it takes some energy to create the bubbles – That's why shaking a soda makes it fizz. Happy New Year!

Saturday, February 18, 2017

"A Temper That Never Tires"

Last week, I talked about how Marika was looking out for our health with fitness-tracking watches.  This week, I moved us in the opposite direction by making Valentine's Day truffles.
Like most chocolate candies, the recipe involves tempering the chocolate.  If you've ever melted chocolate, then let it resolidify, you may have noticed it doesn't go back to the crunchy texture you usually expect.  This is because only one of cocoa butter's six crystal forms has the properties we want.

Crystals are repeating patterns of atomic links.  Depending on the angles between these links, the crystals have different properties.  Here's a pair of examples:
On the left is a square grid, while the right is triangular.  In addition to different angles, the atoms also have different numbers of neighbors, which can also affect the bonds.

Tempering chocolate involves heating it enough to break the bonds, then cooling rapidly to form the beta crystals that have the desired texture.  The method I use suggests adding some unmelted chocolate during the cooling process, which partly cools the mixture further, but it may also provide a starting point for the crystals.  Existing structures play a big part in how a crystal grows.

In the video below, the presenter drops a salt crystal into a supersaturated solution.  The presence of the crystal causes salt in the solution to precipitate out and join the structure:
My brother went to Vassar College, and every year at parents' weekend the Chemistry Department would put on a "Chemistry Magic Show" – This was always one of the features.

Saturday, December 17, 2016

A Long Haul


We've already had inches of snow building up in Ann Arbor, making it a little more difficult to get around, and it got me wondering about snow removal in a city.  For large snowfalls, there isn't really room for big piles, so the snow would need to be hauled elsewhere.  How much cheaper is that than melting the snow with, say, blowtorches?

Melting snow involves overcoming the latent heat of the ice crystals.  This is the energy contained in the crystalline structure – I've mentioned this property before in the case of candle wax.  If we assume the snow is already at the melting point of 0°C, then we still need 334 kJ of energy per kilogram of snow.

Figuring out the energy needed to move the snow is a little more complicated, since it involves converting the gas mileage.  Current semi trucks get about 6.5 mpg with diesel fuel.  Diesel engines are relatively efficient (though they produce nastier byproducts), converting about 45% of the chemical energy into mechanical work.  The final piece we need is the amount of energy in a given volume of fuel, 35.8 MJ/L.  Putting these together, we can find the energy needed to move a truckload of snow a given distance: 2.16 x 10^-5 miles/kJ.

The maximum weight this truck can carry is 80,000 pounds, so we can calculate the energy to melt that much, 1.21 x 10^10 Joules (not jigawatts, sadly).  So how far would we need to haul the snow to make it more efficient to melt?  26 million miles, or several trips to the moon and back, but only 1/5th of the way to Mars.

I wasn't expecting to have a breakthrough snow removal technique, but this does seem a little high.  It's possible I'll find a mistake later, so take these results with a grain of salt (yet another snow-removal method).

Correction: I left out a factor of 10^-5 in my calculation above.  The actual distance is 262 miles.  Thanks, Kevin!

Saturday, December 10, 2016

Not with a Bang

Another question this week from my grandfather-in-law-to-be, George: How does entropy work on the scale of the universe? Doesn't gravity reduce entropy by pulling things together?

Before I get into this, I should first explain what entropy is.  I've mentioned it before as a type of randomness, but it's a bit more complicated.  First, there's the idea of microstates and macrostates.  Imagine we have a box with 10 particles bouncing around inside, and we take a photo at two different times:
 These look basically the same, even though the particles are in different places.  These are two microstates belonging to the same macrostate.  Now we take another photo, and find this:
This is qualitatively different, and is therefore a different macrostate.  However, there are far fewer ways to put all the particles in one corner like that, so the number of microstates is much smaller.  Thermodynamics assumes that all microstates are equally likely, which is why we usually only see the macrostates that have many of them.

Entropy is a way of measuring how many microstates a configuration has.  It's defined as
where k_B is Boltzmann's constant, and Ω is the number of microstates.  The second law of thermodynamics says that entropy always increases in any process – In a way, it defines the progress of time.  A common example is a box with two gasses separated by a divider.  If you remove the divider, the gasses will mix, and there are astronomically more ways for them to be mixed than separated, so they will not return to the original state.

So now, back to the original question.  It seems as if increasing entropy would imply the universe would smooth out to an equal amount of matter everywhere, but gravity acts against that.  The key is that when gravity brings lots of matter together, you can end up with a black hole.  It is believed that black holes carry entropy proportional to the area of their event horizons, which in turn is proportional to the mass that has fallen into them.  Therefore by collecting matter, a black hole is not violating the second law.

That leaves us with a rather sad conclusion called the heat-death of the universe.  If entropy continues to increase, it will reach some maximum value, at which point the universe will be a uniform temperature at all points.  Differences in temperature are required to extract energy from a system, so heat-death implies that no processes can occur after that point.
This is the way the world ends
Not with a bang but a whimper.
        –T. S. Eliot

Saturday, November 26, 2016

Ising the Body Electric

Last week I was in Chicago, visiting my friend Kevin, so I didn't get around to putting up a post, but I did get some material for this week: I've been going to a lot of shows, concerts, and other group events lately, and it got me thinking about crowd dynamics, specifically standing ovations.  I figured there were two factors that determined whether someone would stand up during applause:
  • The quality of the performance
  • Whether nearby people were standing
These two conditions reminded me of the Ising model used to simulate magnetic materials.  The idea is that in a ferromagnetic material (like iron), we can imagine a bunch of arrows, called spins, that point up or down.  The energy of any particular spin is related to those of its neighbors: +1 for each opposite spin, and -1 for matching spin (remember that low-energy states are preferred).  Here's an example:
In the Ising model, we pick a random spin at each time step, and decide if it should be flipped.  The probability is given by the Boltzmann distribution,
where ΔE is the difference in energy between the current state and the flipped state, and kT is the thermal energy.  For cases where the new state is lower energy, we get P > 1, so a flip is guaranteed.  We can also introduce an overall field, which biases the system in one direction – This could represent a permanent magnet near the iron, for example.
So how does this relate to audiences?  Each person can represent a spin, and their neighbors influence their probability of standing or sitting.  Someone could stand independent of their neighbors for an exceptional performance, so that's the external field.  Temperature relates to how willing people are to switch between standing and sitting.

I wrote up a version of the algorithm in Python, which you can try for yourself – I added a bunch of comments, so I hope it's not too opaque.  Here are the results for a performance not quite up to snuff:
And one that got the pixel people a bit more excited:
The only difference in conditions for these was the "performance quality" (external field): 0.1 for the first one and 0.5 for the second.  If you come up with any interesting settings yourself, be sure to leave a comment!

Saturday, October 8, 2016

Let Them Heat Cake

[Programming Note: I've noticed looking through older posts that the equations have picked up extra + signs, due to my impolite hotlinking.  I plan to go through and fix those when I have a chance, but until then, don't take them at face-value.]

Another great question from a reader, this time my own mother, Sally: I’m making a carrot cheesecake for Steve’s birthday. The cheesecake layer is supposed to go into an 9” springform pan but I only have 8”[...] I assumed I’d just make the cheesecake layer thicker, but how to determine baking time? The volume is the same but the height is 25% greater. Thicker tends to mean longer baking. But how do i determine that? What role does oven temp play? What role does moisture level of cheesecake play?

I've talked about heat transfer before, in this post about making granita, but I'd like to take a different approach this time, using the more general heat equation:
This says that the rate of temperature change at a point in the cake is proportional to the variation in temperature nearby, and the thermal diffusivity, α.  This quantity depends on the substance we're interested in, but I don't think it's been tabulated for cheesecake batter, so we'll assume it's about the same as water, 0.143 × 10⁻⁶ m2/s [this is the role the moisture level plays].

Technically, this is a 3-dimensional problem, but thanks to the cylindrical symmetry of the cake, we can just consider a 2d cross-section through the center.  We can assume the outer surface of the cake is fixed at the oven temperature, 325°F.  Then we can use a numerical solver to find the temperature throughout the cake over time.  As it happens, I wrote a solver for this equation a few years ago for a Computational Physics class.  After a few adjustments, it was ready to go: bake.py

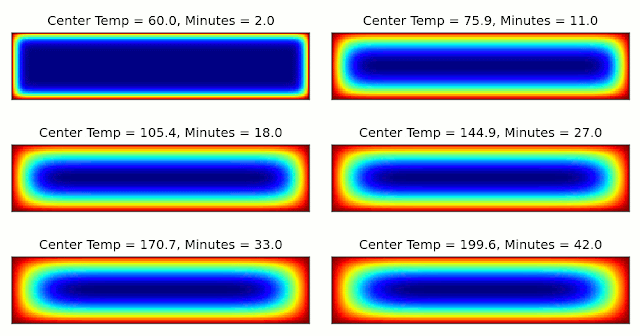
First, we need to find the internal temperature that the cake reaches after the prescribed 45 minutes of baking.


The final temperature after 45 minutes is 206°F.  This is a little close to the boiling point of water, 212°F, where I expect things to get a bit off from the approximations I'm making, but we'll go with it.  Then we can start again with a narrower cake of the same volume, and find how long it takes to get to that temperature.

The final time is about 70 minutes, which isn't completely unreasonable, but I take no responsibility for any charred cakes this calculation results in.  Thanks for a great question, Sally!

[Edit: One first posting, I mistakenly used 8/9" as radii, rather than diameter.  It doesn't actually make a difference in the final results, since the thickness dominates.]

Monday, July 11, 2011

Newtonian Granita

Last night I made some Watermelon Granita, but the pan I used to freeze it was smaller than the recipe called for.  It got me thinking about how the dimensions of the pan affect the rate of freezing.

Assuming we have a rectangular pan, the volume is simply
and the surface area is
In comparing pans, we'll want the same volume, so we can combine these to eliminate a dimension:
According to Newton's Law of Cooling, the difference in temperature between the pan and the surrounding air in the freezer will be given by
where r is defined as
and h is the heat transfer coefficient, m is the mass of the substance being cooled, and cp is the specific heat capacity of the substance.

We're interested in how long it takes the granita to freeze, so solving Newton's equation for t gives
Notice that the only thing that will change with the container dimensions in this equation is A, so for any pair of containers, we can write
This is a surprisingly simple equation – a pan of half the area will take twice as long to freeze.  This isn't perfectly accurate, since Newton's Law of Cooling is an approximation, but I still expected something much more complicated.