Pages

Sunday, April 16, 2023

Da Breeze of Debris

I recently saw a blog post suggesting publicly available datasets good for testing analysis techniques. Paging through them, I found the US Government's data server included NASA resources, and a connection to my own research occurred to me: One of my colleagues at the University of Florida has been working on simulating the effect of micrometeorite impacts on the LISA spacecraft. At a recent meeting, he was discussing the direction the meteorites might hit the spacecraft – They're generally falling inward toward the Sun, while the satellites (and the Earth) are orbiting around the Sun:

According to this model, very few meteorites should hit from the side facing the Sun. Less obvious though is the other 3 sides: Do more hit the side opposite the Sun, or is there a greater effect from the orbit taking us into the meteorite's path?

NASA's datasets include a record of meteorite landings on Earth, spanning the last 2 centuries, but unfortunately only provides the year, which means we can't find the Earth's position in the orbit. I almost gave up, but then I found a list of Fireball and Bollide Reports, which gives the precise date. Unlike the previous table, these are objects that completely burned in the atmosphere. We can look at the locations where these events were reported, using one of the map projections I discussed a while ago:

These appear fairly evenly distributed, but this plot doesn't consider the location of the Sun. Using the Astropy package, we can find the location of the Sun for a given date, then find the angle from the Sun to Earth, to the direction of the report:

This would seem to suggest that the most common angle is 90°, which corresponds to the orbit taking us into the meteorite. However, there are some significant caveats to this conclusion: It may be that there's a bias in this data, since it's easier to see a streak across the sky, while a meteor coming head-on would just appear as a point. Then there are the limitations of my analysis: The table only give the date of the events, not a time, so I may be introducing bias by choosing midnight. I'll be curious to see what results my colleague turns up, and maybe I'll find more datasets in the list to play with in the future.

Sunday, April 9, 2023

Anneal Before Zod

Almost a year ago, I promised to talk about annealing, and now I'm finally getting around to it! I mentioned that you might be more familiar with it than you think, and that's because it's behind something often referred to as the Brazil Nut Effect. I'm not a big fan of mixed nuts, but I do like granola:

Granola will typically have a variety of sizes of cluster, and shaking the bag causes the larger clusters to rise to the top. This happens because the smaller clusters can pack together more densely, and by having those lower in the bag, the system is in a lower energy state. What's interesting is how we got to that lower energy – By shaking the bag, we're adding energy. This seems counterintuitive, but it's the process behind annealing.

If we imagine a potential energy plot like the one I showed a few weeks ago, we can think about how to find the lowest energy state:

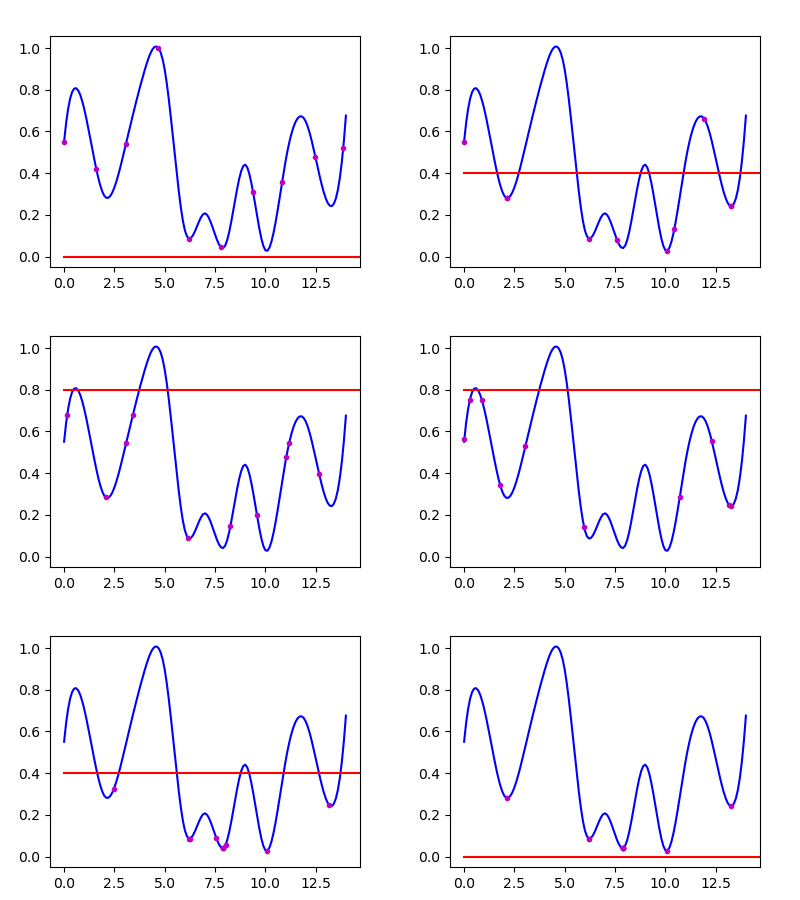
We could think about rolling a ball over these hills – We'd like it to settle in the lowest troughs, around 7.5 or 10, but it could get stuck in the ones at 2 and 13, analogous to the large clusters being stuck at the bottom of the bag. To solve this, we can give the ball a temperature, which represents an average velocity. By increasing the temperature, we can get the ball to explore the full range of states, then cool it down gradually to allow it to settle in the lowest-energy position. In the graph below, I've done this with several balls, initially spaced across the full range. The red line shows the temperature, which rises and falls.

A few balls still get trapped in the higher energy states, but the majority find those central troughs. Every time I shake a container to get things to settle, I think about this effect – Maybe now you will too!

Sunday, April 2, 2023

Ring Around the 'Rora

Recently I started reading a page called Michigan Aurora Chasers, which shares pictures of the aurora taken in our current home state. The pictures are incredible, but I was really interested by a post that came up discussing Newton's Rings, an effect that can sometimes appear when viewing light from a monochromatic source through a series of lenses, like a camera.

Wikipedia has an example of the effect in a microscope, viewing a sodium lamp:

Wikipedia

For aurora viewers, this happens due to using a flat filter over their curved camera lens. When the light passes through the filter, some will bounce between the lens and filter one or more times, changing the phase. This light can then interfere with the light that passed straight through, producing the dark fringes seen above. The extra distance traveled by the light changes depending on how far from the center of the lens it hits:


The wavelength of light also changes how these rings will appear, since the total phase change from bouncing once from each surface is φ = 4πd/λ, where d is the distance between the filter and lens, and λ is the wavelength. We can scan through the visible wavelengths to see how the pattern of fringes changes (thanks to John D. Cook for the wavelength/RGB conversion):
Due to the spherical shape of the lens, as we get farther from the center, the distance changes more rapidly. This means that if we add up several wavelengths (since true monochromatic light is rare in nature), we see that the rings are only visible near the center of the image, as in the aurora photos from the link at the top:

Our area of Michigan is a bit too far south to get to see the aurora in our own sky, so it's been great to get to see the amazing pictures the group members post. On top of that, they introduced me to this really neat optical effect – Thanks Michigan Aurora Chasers!